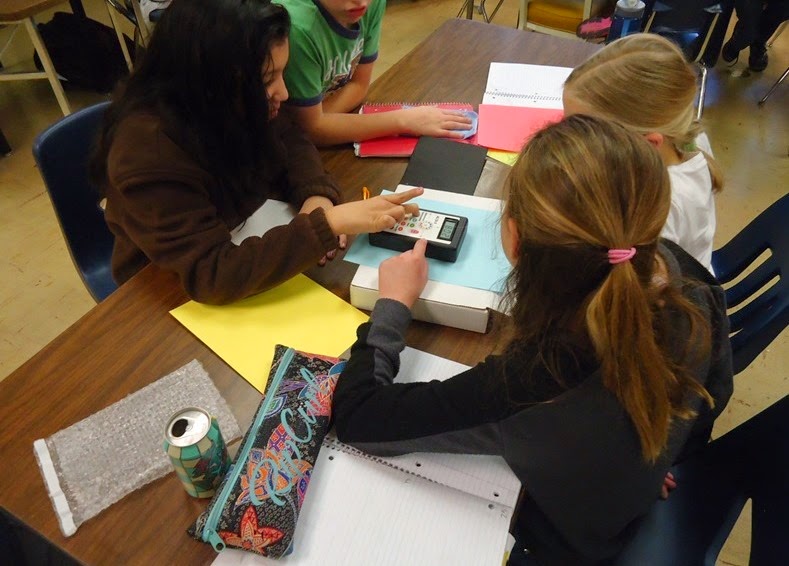
Sixth grade students at UW Lab School saw how nature and man-made changes have altered Earth’s surface. As part of the WyomingView Earth Observation Day activity (Dec 5 and 12, 2014), sixteen students were introduced to data collection in the visible and invisible portions of the electromagnetic spectrum.
After introducing electromagnetic spectrum in his sixth grade class, Andy Pannell, invited WyomingView PI to his class for describing how scientists collect and analyze spectral data. First, students collected spectral reflectance of colored papers and compared their reflectance patterns. Students then learned that satellites collect similar data using very sophisticated and expensive sensors, and the data collected over the past several decades can be used for mapping changes in the landscape. Pannell commented that the “incredible satellite images that helped our students see the usefulness of these understandings, as well as wavelengths outside the visible spectrum, in a real-world context.”
Student feedback about remote sensing and its benefits to society are listed below (students are identified by initials for privacy purposes):
“It helped me with understanding radiation because I couldn’t see what was happening but something was [happening] and it was AMAZING”
“Showed us how people use thermal scans to find wildfires” G
“Helped me understand how using IR and UR might be helpful to find different info.” HB
“Showed me that different colors reflect different amount of light” Z
“Makes things look so different” SH
“Those images were surprising and they helped [me] to understand electromagnetic radiation”
“I know that the [satellites] are really important to see our earth” SS
“Showed me reflecting lights of the trees, and it also showed the bad and good ones” CD
“Showed us how people use different ways to show wildfire, water shortages, bad soil etc.”
 |
| Measuring spectral reflectance of color papers using ALTA II Spectrometer |
After introducing electromagnetic spectrum in his sixth grade class, Andy Pannell, invited WyomingView PI to his class for describing how scientists collect and analyze spectral data. First, students collected spectral reflectance of colored papers and compared their reflectance patterns. Students then learned that satellites collect similar data using very sophisticated and expensive sensors, and the data collected over the past several decades can be used for mapping changes in the landscape. Pannell commented that the “incredible satellite images that helped our students see the usefulness of these understandings, as well as wavelengths outside the visible spectrum, in a real-world context.”
Student feedback about remote sensing and its benefits to society are listed below (students are identified by initials for privacy purposes):
“It helped me with understanding radiation because I couldn’t see what was happening but something was [happening] and it was AMAZING”
“Showed us how people use thermal scans to find wildfires” G
“Helped me understand how using IR and UR might be helpful to find different info.” HB
“Showed me that different colors reflect different amount of light” Z
“Makes things look so different” SH
“Those images were surprising and they helped [me] to understand electromagnetic radiation”
“I know that the [satellites] are really important to see our earth” SS
“Showed me reflecting lights of the trees, and it also showed the bad and good ones” CD
“Showed us how people use different ways to show wildfire, water shortages, bad soil etc.”
No comments:
Post a Comment