Article originally published in
Reflections a publication of the UW College of Agriculture and Natural Resources (Publication date: June 2010; pages 56-58)
Access the issue online at:
http://www.uwyo.edu/uwexpstn/publications/reflections/2010/reflections_2010.pdf (5.3 MB)
* * * * * * * * * * *
Enhanced learning through student selected agricultural remote sensing projects
Students utilize high-tech opportunities to examine Wyoming crop, ranch, and forest areas
 |
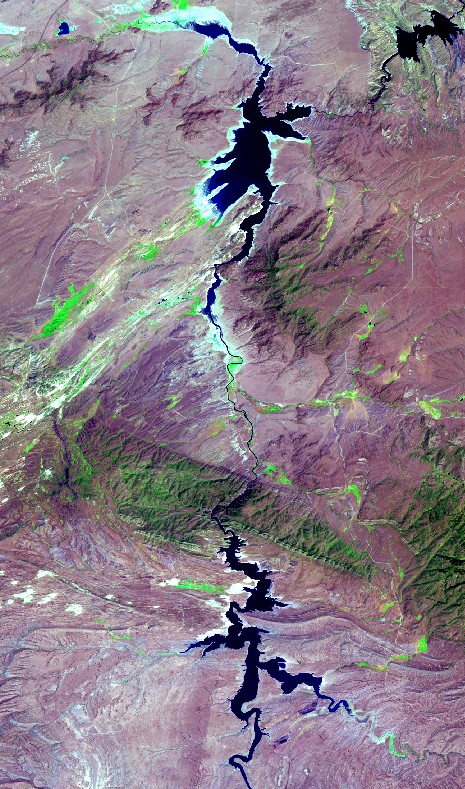
| Carla Grefroh of Douglas, WY compares vegetation on her family’s ranch during drought and wet years |
Images from earth observation satellites provide valuable information for students and researchers interested in monitoring natural resources. These remotely sensed images provide a bird-eye’s view of the earth’s surface and enable monitoring of rangelands, shrublands, and forests.
Many remote sensing satellites collect images at regular intervals, giving researchers an opportunity to monitor changes on the earth’s surface. They can also be used to characterize variability in vegetation conditions within an agricultural field, ranch, or forest. Vegetation growth stage (emergent vs. full canopy) and condition (healthy vs. stressed) can be determined by examining reflected infrared light, which is measured by many remote sensing satellites.
In general, remotely sensed images contain a wealth of information about the earth’s surface and are valuable for a wide range of users.
Remotely sensed satellites divide the earth surface into a uniform grid comprised of pixels and record the amount of reflected visible and infrared light coming to the satellite from each pixel. Analysts examine the pattern of reflected light across a range of wavelengths to extract information about places in an image. For example, a farmer can monitor changes in crop growth during the growing season using a series of Landsat images (Box 1). A rancher can map forage conditions on a ranch and also identify areas of poor or no vegetation growth.
| Box 1: Landsat images
|
| Landsat images have been collected by a series of remote sensing satellites operated by the U.S. government since early 1970s (http://landsat.usgs.gov) and represent an extensive civilian archive in terms of duration (more than 36 years) and geographic coverage. Landsat collects a new image every 16 days for every place on earth. Each image covers a relatively large geographic area (approximately 90 miles x 90 miles). Landsat records information from the visible region and the infrared regions of the spectrum, which is useful for monitoring vegetation condition and for a wide variety of other applications. Countless studies have demonstrated the value of Landsat data for monitoring changes in croplands, rangelands and forests. Landsat images are useful when monitoring rangelands and croplands through conventional field surveys is not feasible due to cost or access issues.
|
Increasing student employment potential
Changes introduced by natural disturbances, such as wildfires and droughts, and anthropogenic activities, such as land conversion, are creating new applications of remotely sensed imagery. Because the imagery is so valuable, several countries have launched remotely sensed satellites to collect earth observation data. In the U.S., federal and state government agencies, as well as private companies, are launching and operating remote sensing satellites. Students who learn image processing and interpretation skills as part of their academic training often increase their employment potential.
Ag remote sensing projects
UW students are learning to implement many of the applications described above in the Applied Remote Sensing for Agricultural Management (BOT/RNEW 4130/5130 and AECL4130) course. One requirement of this course is that students complete a class project using imagery to answer questions about a real-world agricultural issue. For example, some students use images of their parent’s farm or ranch to obtain a better understanding of crop growth patterns by comparing the images to conditions observed on the ground.
Students associate areas of poor growth (often characterized by low infrared reflectance) identified in the image to problems such as soil alkalinity or poor water drainage. Similarly, several students obtained images acquired in normal and drought years for rangelands and mapped changes in vegetation condition. Students enhanced their learning experience by selecting images for areas of interest to them rather than working on pre-defined laboratory exercises.
Mapping crop growth in the Big Horn River Basin
Garret Klein and Laramie Wiginton (rangeland ecology majors), Chris Heil (agroecology major) and Travis Yeik (geography major) used Landsat images for monitoring crop growth in agricultural fields in Freemont and Washakie counties.
Klein and Wiginton mapped crop growth by computing a vegetation index derived from the amount of reflected red and infrared light. Based on their research, they concluded Landsat images could be used to accurately identify areas of poor and medium growth for different crops; however, they noticed some weed infested areas also had high infrared reflectance due to dense canopy, thereby reducing the utility of Landsat data under these circumstances.
Yeik analyzed growth patterns in sugar beets and alfalfa crops in Worland using Landsat images acquired from 2006, 2007, and 2008. This multi-year analysis of crop growth patterns was necessary for identifying areas of poor and high growth and for devising appropriate management plans to help improve crop yields.
Assessing wildfire damage to forest vegetation
Using Landsat images, Cody Tully estimated wildfire burn severity of a
fire in Medicine Bow National Forest, Brice Stanton and Adam Stephens
for a fire in the Black Hills National Forest, and Anne Morabito for a
fire in Southern California. Stanton and Tully worked on firefighting
teams and had firsthand knowledge of the impacts of fire on forest
vegetation. This knowledge was valuable for interpreting the
information derived from Landsat images about burn severity patterns.
 |
Cody Tully of Sinclair, WY helped fight the 2006 Isabelle Fire that burned near
Lake Owen in Southeast Wyoming. He is examining satellite images of the burn |
Tully fought the 2006 Isabelle Fire that burned 1 mile south of Lake Owen in southeast Wyoming. Burn Ratio Indices derived from the Landsat images acquired before and after the wildfire enabled him to distinctly classify the burned areas and also group them by severity classes.
Using the same method, Morabito (a California native) generated burn severity maps depicting various levels of damage caused by the Station Fire near Los Angeles in Southern California during August 2009. Methodology used by these students is identical to the methods used by federal and state land management agencies tasked with fighting wildfires and monitoring vegetation establishment in burned areas.
Monitoring Wyoming Rangelands
Most students used Landsat images for monitoring rangelands throughout Wyoming. Students compared vegetation condition during drought years to normal years and estimated the differences in spectral reflectance in different regions of the electromagnetic spectrum. For example, Carla Gefroh (rangeland ecology major) compared the vegetation condition for her family ranch using images acquired in June 2002 and 2009, representing drought and wet years, respectively. Landsat images highlighted changes in vegetation condition during the drought and wet years.
Monitoring vegetation response to drought was one topic in the class. Other projects included monitoring vegetation condition in a growing season for estimating forage availability and areas of overgrazing. The synoptic view provided by Landsat images was invaluable for gaining insights about vegetation condition in rangelands, and repeat coverage helped students to map those changes.
USGS Offers Landsat Satellite Images for Free
In December 2008, the entire Landsat satellite image archive was made available for free through the U.S. Geological Survey. Previously, images had to be purchased (terrain corrected images could cost as much as $800) unless they were archived by programs like AmericaView (http://www.americaview.org) or on dedicated public Web sites like that of the Global Land Cover Facility (http://glcf.umiacs.umd.edu).
The recent availability of no-cost Landsat images has created opportunities and enhanced learning experiences for students. When fewer no-cost Landsat images were available, students had to modify the scope of their projects to match data availability. Now, students can download any number of images for anywhere on earth.
UW students enrolled in the Applied Remote Sensing for Agricultural Management course are taking advantage of this valuable opportunity and are using these images for monitoring and mapping Wyoming croplands, rangelands, and forests.