Friday, December 12, 2014

Monitoring our changing environment using satellite images: Earth Observation Day activities in UW Lab School

Sixth grade students at UW Lab School saw how nature and man-made changes have altered Earth’s surface. As part of the WyomingView Earth Observation Day activity (Dec 5 and 12, 2014), sixteen students were introduced to data collection in the visible and invisible portions of the electromagnetic spectrum.

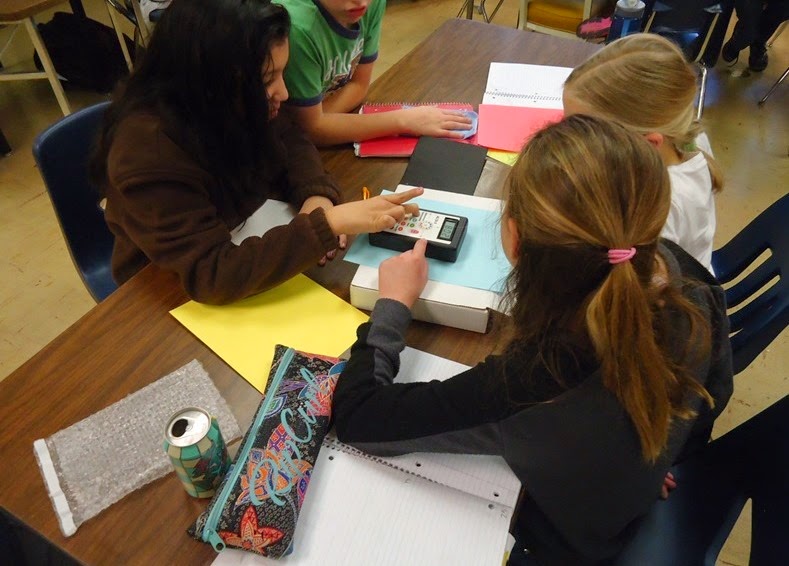
Measuring spectral reflectance of color papers using ALTA II Spectrometer

After introducing electromagnetic spectrum in his sixth grade class, Andy Pannell, invited WyomingView PI to his class for describing how scientists collect and analyze spectral data. First, students collected spectral reflectance of colored papers and compared their reflectance patterns. Students then learned that satellites collect similar data using very sophisticated and expensive sensors, and the data collected over the past several decades can be used for mapping changes in the landscape. Pannell commented that the “incredible satellite images that helped our students see the usefulness of these understandings, as well as wavelengths outside the visible spectrum, in a real-world context.”

Student feedback about remote sensing and its benefits to society are listed below (students are identified by initials for privacy purposes):

It helped me with understanding radiation because I couldn’t see what was happening but something was [happening] and it was AMAZING

Showed us how people use thermal scans to find wildfires” G

Helped me understand how using IR and UR might be helpful to find different info.” HB

Showed me that different colors reflect different amount of light” Z

Makes things look so different” SH

Those images were surprising and they helped [me] to understand electromagnetic radiation

I know that the [satellites] are really important to see our earth” SS

Showed me reflecting lights of the trees, and it also showed the bad and good ones” CD

Showed us how people use different ways to show wildfire, water shortages, bad soil etc.”

Wednesday, May 14, 2014

WyomingView interns describe how satellite data can be used for monitoring past environmental changes

Emily Richardson (BS Botany) monitored aspen tree growth in normal, wet, and dry years along an elevation gradient in the Sierra Madre Mountains. She computed a vegetation index from Moderate Resolution Imaging Spectrometer (MODIS) data acquired in 3 years and analyzed tree growth based on their phenology curves. Aspen stands growing at lower elevations exhibited major changes during these three years, whereas their growth patterns at higher elevations did not show such variations.


Ryan Lermon (BS Rangeland Ecology & Watershed Management) mapped the burn severity at a prescribed fire site north of Rawlins, WY. Prescribed fires are part of forest management methods aimed at reducing fuel load, and improving overall habitat quality. Following a prescribed fire event, land management agencies are required to map how fire moved through the landscape but lack the necessary resources to generate it. Using a Landsat 8 image acquired after the fire, Ryan mapped the impact of this prescribed fire as high, medium, low and no-burn classes. This map will be used by agencies to establish field sampling plots for monitor vegetation regrowth.


Emily and Ryan presented their work in the Wyoming Undergraduate Research Day on 26 April 2014.


Following newspapers published a short description of Emily's work:


Laramie Boomerang - May 10, 2014 - Link to article

Casper Star Tribune - May 12, 2014 - Link to article

Washington Times - May 10, 2014 - Link to article

Monday, March 31, 2014

Eighth graders associate spectral reflectance patterns with plant form, health status

Eighth grade students at Laramie Junior High School learned to measure the spectral reflectance of leaves and analyze differences based on their types (conifers vs. deciduous) and health status (live vs. dying) during presentations by Ramesh Sivanpillai, principal investigator for WyomingView. The more than 75 students also learned how sensors in remote sensing satellites collect similar data about Earth surface features.

Students providing their feedback on remote sensing concepts and the hands-on activity that aimed at comparing spectral reflectance values of live vs. dead leaves from conifer and deciduous trees.

Ron Whitman, physical sciences teacher at the school, invited Sivanpillai to four sections of his eight grade classes to highlight remote sensing science and applications. “Ramesh introduced the electromagnetic spectrum with a very informative power point presentation during class period[s,]” he said. Whitman trained students to collect spectral data of the leaves, enter them in spreadsheet, and analyze them. This year’s activities spanned four class periods. “I was able to teach, on my own, the aspects of remote sensing, collection of data, displaying data and interpreting research data as initially taught by Ramesh,” he said.

Whitman noted the students continue to be excited about remote sensing and simple and complex tools. “Students compared their own data and other students’ data and discussed what was similar, different, and reasons for error,” he said. “Ramesh came back and helped students interpret their data and compare to other practical research by colleges and college students.”

WyView coordinator discuses phenology and leaf color changes in aspen trees

Student feedback highlighted different aspects of this lecture and hands-on exercise. Students are identified by initials for privacy purposes.

"I learned that the spectral reflectance values of things make a big difference in the world." KD

"I learned that the colors that you can see are based on what colors are reflected of of the object." KW

"I have learned that plant give off infrared radiation waves. They help us tell if the plant is healthy." DR

"I learned how to graph on the excel and I learned how to use a spectrometer" MH

"I also learned how satellites check out the environment from space from all around the world ... we learned how to plot and compare reflectance values." SH

"In the hands on activity I learned how to calculate the percent of reflectance of colors." CH

"I learned that live leaves reflect more than dead leaves." NT

"We also learned how to use Microsoft Excel and how it can graph scientific data." JW

"... a live leaf absorbs more of every other color but reflects green the most." SH

"I can definitely say that I learned new information about electromagnetic radiation and how it affects the colors that are visible for different species." KW

This event was conducted on March 31, April 1, 2, 8, 9 and May 19 as part of AmericaView’s Earth Observation Day activities aimed at introducing remote sensing science and applications to K-12 students and teachers.

Friday, March 14, 2014

Conner’s aspen phenology study wins third place in the 2014 Wyoming State Science Fair

Conner Whitman, an 8th grader in Laramie Junior High School, monitored leaf color changes in 3 aspen trees for 29 weeks (May – Oct 2013) by measuring their spectral reflectance values every week.

His research focused on how age and health status of these aspen clones influenced the changes in their leaf pigments. Every week starting in the spring, he collected leaves from 2 healthy (young and old), and 1 stressed (young) aspen trees and measured the amount of light reflected in eleven different wavelengths.

For comparison he also measured light reflected by an Engelmann spruce. Most conifer trees like Engelmann spruce do not exhibit prominent leaf color changes.
Using the amount of light reflected in infrared and red portions of the spectrum he calculated the different index which can be related to the amount of leaf chlorophyll content in each tree.


His results (figure above) indicated that the rate of chlorophyll change was influenced by health status of individual aspen trees within a clone. However there was no difference between the young and old healthy aspen trees. The light reflected by Engelmann spruce steadily increased throughout the year and did not show the declining trend in fall season.


Conner presented his research findings in the 2014 Wyoming State Science Fair in Laramie on 3/4/2014 and won the third place in the Plant Sciences category.

Tuesday, March 4, 2014

Abigail’s study on the effect of rain on urban heat island wins a Certificate of Achievement from NCAR and third place in the 2014 Wyoming State Science Fair

Abigail Whitman, a 6th grader in Laramie’s Snowy Range Academy, studied how afternoon rain showers in summer altered the urban heat island effect.

Temperature data collected by her at 3 outdoor locations on 12 days revealed that concrete, grass, and asphalt surfaces rapidly cooled following PM rainfall events in comparison to non-rainy days. Temperatures of all three surfaces dropped gradually on sunny days with no rain. At the end of the day, asphalt and concrete recorded higher temperatures than grass lawns. On rainy days temperatures of these surfaces dropped rapidly following the rain event. However the pattern of temperature drop of these three surfaces did not change. Her research revealed that in addition to rain, wind and clouds also influenced the rate of decrease in temperature of these surfaces.


Abigail presented her research findings in the 2014 Wyoming State Science Fair in Laramie on 3/4/2014 and won the third place in Earth and Planetary Sciences category.  Additionally she was awarded a Certificate of Achievement from the National Consortium for Atmospheric Research (NCAR) in the Junior Geoscience division.