Friday, September 27, 2013

WyomingView sponsored students present their research findings in 2013 Geospatial Conference of the West (GeCo West) Conference


Four WyomingView sponsored students presented their research about the urban heat island effect, image analyst bias and utility of indices to map water bodies in the recently concluded 2013 GeCo West Conference in Laramie, WY. WyomingView coordinator mentored these students on these projects.


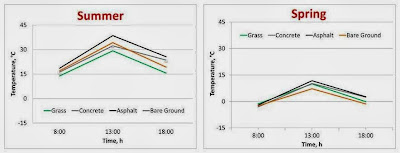
Sarah Arulswamy, a 9th grade student at Laramie Junior High School, has been studying the urban heat island effects in Laramie since summer 2012. Earlier she presented her findings based on summer, fall and winter data in the 2013 Wyoming Science Fair. She continued her study in spring 2013 and presented the findings in this conference. Urban heat island effect was evident in spring but at a much lesser magnitude than what she observed in 2012 summer (Figure below).


Bailey Terry (BS Rangeland Ecology & Watershed Management) has been estimating analyst bias introduced during Landsat image classification. She described how small differences introduced by the analysts during the interpretation process influences area estimates of earth surface features.


Kaitlyn McCollum (MS Agricultural Economics) and Matthew Thoman (BS Rangeland Ecology & Watershed Management) tested the transferability of threshold values of commonly used indices for mapping water bodies. In their talk they described how well threshold values generated for one water body can be transferred to other water bodies in space and time.


Additional photos from these presentations can be found at WyomingView’s Google+ site.

Tuesday, September 17, 2013

WyomingView workshop highlights the value of no-cost Landsat data for natural resources monitoring

WyomingView coordinator Ramesh Sivanpillai described how no-cost Landsat data can be used for monitoring and mapping natural resources in one of the several pre-conference workshops of the 2013 Geospatial Conference of the West held in Laramie, WY. Participants were introduced to remote sensing basics and data characteristics in order to provide an overview of various data sources along with various advantages of Landsat data.

Landsat data constitute the longest collection of remotely sensed earth observations. Starting 2008, the US Geological Survey (USGS) has made the entire Landsat data archive available to users at no-cost which has created an unprecedented opportunity for monitoring and mapping changes to the earth’s surface features.


Participants were introduced to similarities and differences among data collected by various Landsat satellites and how to search and download them for their area of interest from USGS’ web portal - Earth Explorer (earthexplorer.usgs.gov). More information about Landsat data can be found at: landsat.usgs.gov.

Tuesday, June 11, 2013

Researchers generate crop growth patterns for Wyoming farmlands from satellite images

Article originally published in Reflections a publication of the UW College of Agriculture and Natural Resources (Publication date: June 2013; pages 40-42)

Access the issue online at: http://www.uwyo.edu/uwexpstn/publications/reflections/reflections-2013-web.pdf (4.2MB)

* * * * * * * * * * *

Researchers generate crop growth patterns for Wyoming farmlands from satellite images

Under precision-agriculture or site-specific management practices, farmers split fields into discrete zones based upon underlying soil properties and past crop growth patterns. By dividing the field into zones, a farmer can devote more resources to zones with medium to low growth to increase output.

Remotely sensed data (images) of crop growth acquired during the growing season in multiple years are essential to understand and map differences in crop growth through time. Data collected in the infrared region (invisible to human eyes) are particularly useful to distinguish differences in crop growth in a field. 

Advances in technology are enabling us to acquire remotely sensed images using sensors mounted in balloons, unmanned aerial systems, or farm vehicles (tractors and trucks, for example). 

Images collected by Landsat satellites date back to the early 1970s and comprise the longest and one of the most complete collections of remotely sensed images. Since these images are acquired once every 16 days, farmers can use them to monitor growth patterns during one or more growing seasons. 

In 2008, the U.S. Geological Survey (USGS) opened the entire Landsat image archive free to users. Now any user can download images directly from the USGS websites http://glovis.usgs.gov or http://earthexplorer.usgs.gov. 

Infrared images acquired by a Landsat satellite show changes in crop growth during the 2007 growing season. Crops with high growth (or vigor) appear bright red due to more reflection in the infrared region. Darker shades of red indicate medium- to low-growth areas. Harvested areas and bare ground appear in shades of green and blue.


University of Wyoming students enrolled in the remote sensing for agricultural management course are taking advantage of this to monitor fields in Wyoming or their home states. 

Monitoring crop growth in one growing season

Carson Hessenthaler, agricultural business major from Lovell, compared sugar beet growth in a field near Lovell that had uneven soil fertility. Using three Landsat images acquired at different times of the year, he tracked growth in areas that showed poor, medium, and high growth at the start of the growing season (Figure 1).
Figure 1: Landsat images revealed differences in the sugar beet growth for the
2011 growing season at a farm near Lovell.
His analysis revealed that areas with high-, medium-, and poor-growth patterns at the start of the season stayed more or less same until the end of the season. However, areas with poor growth at the start had relatively more growth, albeit small, throughout the season and ultimately narrowed the gap with the other two categories. 

Mapping crop growth between growing seasons

Matthew Thoman, rangeland ecology and watershed management major from Riverton, mapped winter wheat growth patterns in non-irrigated fields east of Cheyenne. Using Landsat images acquired in April, May, and June of 2007 and 2009, he mapped winter wheat growth for the two growing seasons (Figure 2). 

Figure 2: Variations in the winter wheat growth in non-irrigated
fields near  Cheyenne in 2007 (left column) and 2009 (right column).
Each square represents 0.22 acres (900 square meters) on the ground.
Dark green to light green correspond to high to medium growth.  
Yellow and brown colors correspond to low and no growth.
Combining data from three Landsat images acquired during each growing season, he was able to see that between 2007 and 2009, the area under high growth increased from 1.3 to 5.5 acres shown in dark green (Field 1). This increase occurred mostly in areas that had medium growth in 2007. Some of the medium growth areas of 2007 had lower growth in 2009 (yellow); however, this decline was noticed along the edges.

The second field showed increases in high and medium categories and decreases in low and bare ground categories. While no part of this field was classified as high growth in 2007, four acres witnessed high growth in 2009. On the other hand, areas of low growth decreased from approximately 11 acres in 2007 to 5 acres in 2009.

These examples demonstrate how information derived from Landsat images can be used to identify areas where crop growth varies between years. Farmers and crop consultants can use this information to devise suit-able management plans for increasing crop growth.

Tracking changes through multiple years

Availability of free Landsat images provides numerous other possibilities for monitoring growth in Wyoming croplands. For example, farmers can adapt Hessenthaler’s technique and obtain images from several years to analyze crop growth prior to its maturity.

Tuesday, May 14, 2013

Students saw value of satellite images for monitoring, mapping water bodies

Sixth grade students at Laramie Junior High School saw how remotely sensed images are used for monitoring changes in water bodies around the world. Students took virtual tours of how countries manage their water resources by building reservoirs, diverted water from Rivers, and how their impact on already existing water bodies.


Jerod Long, the Social Studies/Science teacher at the 6th Grade Academy, commented "As a teacher of social studies and science, I am constantly seeking instructional techniques that allow my students to understand the interdisciplinary nature of any given topic. 

Our sixth graders are currently in the middle of a unit on water, in which we have been looking at issues revolving around distribution, consumption, water quality, implications for wildlife, implications for human beings, etc. When Ramesh approached me about giving a talk on water-related issues, I jumped at the opportunity: Ramesh brings a unique combination of real-world experience and scientific knowledge that my students benefit tremendously from. 

Ramesh recently gave a talk on water to my 6th graders that seamlessly integrated the many facets of this topic that we have been studying in class. Not only did my students gain a wealth of knowledge from this presentation, they were highly entertained and engaged. The story (ies) that Ramesh was able to tell utilizing aerial photography, digital animations and a well-crafted presentation really piqued an interest with my students."

This event was conducted on April 25 as part of AmericaView’s Earth Observation Day activities aimed at introducing teachers and students to remote sensing science and applications. Sixty students from two sessions and three teachers of the sixth grade academy participated in this event.

Friday, April 12, 2013

Eighth graders measure and analyze the spectral reflection pattern of live and dead plant leaves

Fifty-seven, eighth grade students at Laramie Junior High School learned how earth surface objects interact in the visible and invisible regions of the electromagnetic spectrum (light) and measured and analyzed spectral properties of live and dead plant leaves.

Students in the first batch are
collecting spectral data (Apr 2, 2013)
Describing the value of this hands-on exercise, Mr. Ron Whitman, eighth grade physical sciences teacher, said, “[M]y approach to teaching science has always been having the students experience the practical applications of science. Ramesh Sivanpillai from the University of Wyoming in Laramie has been presenting information about remote sensing to my classes for several years.  My 8th grade physical science class is an introductory class for physics and chemistry. One of the topics discussed is electromagnetic waves. Ramesh presented information to my classes for two, 90 minutes sessions. Ramesh introduces the electromagnetic spectrum with a very informative power point presentation. Most of the two 90 minute sessions the students get to use … spectrometers to measure and eventually calculate the percent reflectance of particular wavelengths emitted by dead vs. living deciduous leaves and dead vs. living coniferous needles. This year the students got to plot their data on a computer spreadsheet and have the program calculate and graph the data. Wow! This was awesome. Students compared their own data and other student’s data and discussed what was similar, different and reasons for error. In my assessment of the two 90 minute sessions my students continue to be excited about remote sensing and the tools, both simple and complex, that are able to detect different frequencies of the electromagnetic spectrum.”

Students in one of the three classes are entering their data in spreadsheet
to calculate and graph reflectance values of live and dead leaves (Apr 10, 2013)
Students’ feedback highlighted different aspects of this lecture and hands-on exercise (NOTE: for privacy, students are identified by their initials):

Verifying that all numbers were entered correctly
(Class period 3: Apr 10, 2013)
This experiment helped to understand chapter 6 by showing how the colors change…” - DG
This helped me understand color more. The effects of man can affect earth so much.” – CM
It helped me understand that not all light is visible to us as humans. It helped me understand that nothing has a true color it is just what color we see it in, how our eyes work.” - HS
This hands-on exercise helped me understand colors and the interaction of radiation and it was fun.”- NM
This exercise taught me that different colors reflect different amounts of light, and dead and live deciduous and coniferous trees do too.” – MS
This hands-on exercise helped me to understand the interaction of electromagnetic radiation better because we had the chance to look at real results and also examples. I learned a lot.” – LC
This activity helped me to understand how things may differ in a way we may not be able to understand at first glance. I also learned how to use Excel.” – BC
“…I learned about all the actual colors of things like leaves and flowers. This experiment was really enjoyable.” – IW
This helped because after doing the hands-on activities and seeing them in the graph compared to everyone else, I saw and understood how light reflects and how the basics of remote sensing works.” – TN
This hands-on exercise helped me to understand the interaction of electromagnetic radiation by showing me that it is used in everyday life by a lot of different careers. It was interested and showed me science is more than formulas.” – AM
This event was conducted on April 2, 3, 9 and 10 as part of AmericaView’s Earth Observation Day activities aimed at introducing teachers and students to remote sensing science and applications.

Wednesday, March 6, 2013

Sarah’s urban heat island study wins third place in the 2013 Wyoming State Science Fair

Sarah Arulsamy, an 8th grader in Laramie Junior School, studied how different natural and man-made (artificial) surfaces in Laramie absorbed radiation at different times of the day.

Temperature data collected by her at 5 different locations on 3 different days, revealed that concrete pavements and asphalt roads absorbed relatively more heat in the morning (between 8 am and 1 pm) and released relatively less heat in the afternoon and evening (between 1 pm and 8 pm) in comparison to natural surfaces (grass lawns and bare ground). As a result asphalt roads and concrete pavements continued to be warmer (25°C or 77°F) at 8 pm in comparison to bare ground and lawns (17°C or 63°F). This excess heat stored by artificial surfaces is released during the night time due to the fact that the temperature differences between all surfaces were less at 8 am next day. Similar data collected in fall and winter seasons did not show such drastic variations in the temperatures of different features.


Sarah presented her research findings in the 2013 Wyoming State Science Fair in Laramie on 3/5/2013 and won the third place in the Junior Environmental Sciences category.

During the course of this work she noted that the average summer temperature at 1pm of tire mulch, an artificial surface in a children’s park, was 58°C (136°F). Based on this finding she recommended that the city has to post warning signs to alert parents about potential dangers to unsuspecting children. Her research was supported by WyomingView. She plans to continue this research in the summer of 2013 by including additional sites and more frequent measurements.