Wednesday, June 10, 2026

Native American high school students introduced to Earth Observation & Landsat images

 As part of the 2026 Native American Science Institute (NASI), 35 Native American high school students from Wyoming, Colorado, New Mexico, and Utah were introduced to Earth Observation and Landsat images. These students and their teachers assembled the large floor puzzle of Wyoming’s Landsat image mosaic.


More details about this year’s NASI program and full list of participants can be found at: https://www.uwyo.edu/news/2026/06/uw-hosts-35-native-american-high-school-students-for-ninth-native-american-summer-institute.html


This activity was jointly hosted by WyomingView and UW ASPRS Student Chapter (2026-27 officers: Anais Canto Samudio (President), Tyler Gallager (Vice President), Willam Colin Maloy (Secretary), and Korrin Sutherburg (Treasurer) - (photo below).


Wednesday, May 20, 2026

Wyomining middle & high school students learned the value of aerial & satellite images for monitoring Earth surface changes

More than 20 Wyoming Middle & high school students learned how data collected by Earth Observation (EO) satellites are used for tracking/monitoring farms, rangelands, forests, wildfires, and floods.


Students from Carey Junior High, CY Middle, Laramie Middle, McCormick Junior High, Cheyenne Central High, Moutain View Middle, Cheyenne South High, Dean Morgan Middle, and Johnson Junior High schools learned about geostationary and polar orbiting satellites and how the data they collect are used for tracking hurricanes, floods, wildfires, crop growth, and forest health.

Students viewing an animation of geostationary satellite
Students viewing an animation of geostationary satellite in orbit
(Photo: Jeremy Cain, UW Extension)

As a part of this event, students visited one of NASA's websites and wrote their name using Landsat images (samples names generated with Landsat images shown below).


Interested in making an image with your name? Visit NASA's Your Name in Landsat page.

More info on Landsat: Visit USGS' Landsat page.

Friday, February 27, 2026

Satellite images track global vegetation responses to annual changes to amount of sunlight

 8th graders at Laramie Middle School, as part of MS-ESS-1 content, learned how earth’s tilt, its spin and orbit around the sun causes variations in the amount of sunlight throughout the year and how various lifeforms have adapted to these changes (leaf color changes, migration, hibernation, etc.).


In this outreach activity, students learned how the information collected by sensors mounted on stationary towers, planes, and satellites are used for tracking those changes. Satellite images acquired throughout the year showed the seasonal changes to the amount of green up in the northern and southern hemispheres (figure below). Students gathered the amount of sunlight received in Cheyenne, Wyoming and compared it to another city in the Southern Hemisphere.

Courtesy: NASA Goddard's Scientific Visualization Studio
(Public domain)

Jared Krysl and Joshua Peterson, eighth grade science teachers commented “[This activity] helped to solidify the concepts brought up by our standard as it related to the amount of sunlight in a day and the formation of seasons due to the Earth’s tilt.”

This educational outreach activity was conducted on Feb 26 and 27, at Laramie Middle School, WY.

Friday, May 5, 2023

Satellite images illustrate human influence on the environment – Story of Shrinking Aral Sea

Satellite images showed fifth graders at Spring Creek Elementary School how human actions have converted one of the largest lakes in Asia to the newest desert. Diverting waters from two rivers for agriculture reduced the inflows, increased the salinity of remaining water, caused wildlife to disappear, and created the newest desert in Central Asia.

A pair of satellite images from 1964 (Corona) and 2018 (Terra) show the effect of diverting water from the two rivers flowing into Aral Sea. Satellite images courtesy of NASA Earth Observatory

A 1964 photo from the Corona satellite, several Landsat images from 1970s to 2000s, and annual MODIS images from 2000 showed how the Aral Sea, once the 4th largest inland water body, gradually shrunk exposing most of the sand. Some of these images also showed how dust storms transported large amounts of this sand to various regions across Asia and beyond.

Students were able to see how human actions can make a large lake disappear. Commenting on the value of these images for illustrating human influence on our environment, Mrs. Hayden, their teacher said, “when we discussed what the students learned/remembered from [the] presentation this week, they had lots of takeaways about how the 4 different Earth systems interact and how humans have influenced the environment.” The content included as part of this activity was “closely aligned with the standard we have been focused on”, said Hayden.

This event was conducted on April 28 at Spring Creek Elementary School, Laramie, WY.

Landsat images can be obtained for no-cost from US Geological Survey. More details about Landsat can be obtained from: https://www.usgs.gov/landsat-missions.

Monday, April 24, 2023

Earth Observation Day Event Shows Monitoring Natural Disasters with Satellite Images

Seventh graders in Laramie Middle School (LMS) learned the value of satellite images for monitoring natural disasters. 

Students are learning about natural disasters and how they are impacting humans and their environment. Images acquired before- and after- the floods, wildfires, landslides, earthquakes, etc. from Landsat and other Earth observation satellites showed the extent of damages caused by disasters.

One of the teachers commented "students were able to really take in what damage can be done from the several disasters you shared with them and how, depending on the event, the satellite imaging can provide different forms of information needed."

One hundred and fifty eight students and 2 teachers participated in 6 sessions of this Earth Observation Day activity conducted on April 24, 2023.

Wednesday, April 12, 2023

Introducing Wyoming Geography with Landsat Image Mosaic

WyomingView showcased large Landsat floor puzzle in Wyoming State Museum's monthly outreach activity in Cheyenne, Wyo. 

Assembling the puzzle, elementary school aged kids and their parents saw the diverse landscapes of the state. Further details in UW press release: https://www.uwyo.edu/uw/news/2023/04/large-landsat-puzzle-created-by-uw-researcher-introduces-wyomings-geography-to-children.html 


Monday, September 28, 2020

WyomingView's First Virtual Earth Observation Day Outreach @ Spring Creek Elem. School

Landsat images acquired in2019 show
algal blooms in Keyhole Res. Wyo. These
blooms form under abundant sunlight,
temperature and nutrients. Landsat images
are available from US Geological Survey.


Third graders in the Spring Creek Elementary School (Laramie, WY) learned how satellite images are used for tracking algal blooms in waterbodies throughout the US.

Students in 3rd grade GATE science class are learning about water and sources of water pollution. Currently they are finding solutions to address environmental issues such as oil spills, acidic conditions, and harmful algal blooms. 

First, students learned the sources of chemicals that would eventually become the nutrients for the algae once they enter waterbodies. Algal blooms appear when there is an abundance of sunlight and higher temperatures. 

Next, they saw how algal blooms appear in images captured by Landsat and other satellites. Aerial and satellite images provided by USGS, NASA, and several state environmental agencies were used for this outreach event. These satellite images showed algal blooms in small and large waterbodies throughout the US. 

Describing the value of this outreach activity, Ms. Natalie Davis, their teacher commented “provided students with real life data and imaging that brought all the work we did in class.  Students were able to see real examples of the impact water pollution has, and tie that back to what they had been testing/studying in class the weeks prior”. 

This outreach event was conducted virtually on Sept 23, 2020 due to COVID-19 restrictions.

Monday, September 21, 2020

Landsat 7 captures active fires in SE Wyoming (Sep 19, 2020)

Last Saturday (Sep 19), Landsat 7 satellite passed over the Mullen Fire in Medicine Bow National Forest (Wyo.) and captured the active fires. Images captured in spectral regions that are invisible to humans shows active fires.

The stripes in the Landsat 7 image correspond to missing data due to scan line corrector malfunction developed in 2003. Despite this limitation, images continued to provide valuable information about forests, croplands, water bodies and many more.  Landsat 9, the next satellite in the series, is scheduled to launch in 2021. For more information about Landsat, please visit https://landsat.usgs.gov.

Mullen Fire started on Sep 17, and as of Monday (Sep 21) has burned more than 13,835 acres.  Please visit the InciWeb site for more information about this fire.

Tuesday, May 21, 2019

AmericaView highlights WyomingView's Women in STEM workshops


WyomingView held, not one, but THREE workshops in Laramie, Wyoming as part of the #Women in STEM conference! Among other activities, participants had the opportunity to assess how green and blue paper absorbed and reflected electromagnetic energy - and how that energy was associated with human vision.


These workshops were funded by the U.S. Geological Survey (USGS) National Land Imaging competitive grant to AmericaView #WomenInSTEM #RemoteSensing

Saturday, January 26, 2019

Associating the color of an object with its light reflection (Science Kitchen - Jan 2019)


Twenty five middle school (6th-8th grade) students from Wyoming learned how the color of an object can be associated with the amount of light reflected by it in the different regions of the electromagnetic spectrum.  As part of the hands-on activity organized by Science Kitchen, they measured the amount of light reflected by blue and green color materials using an ALTA II Spectrometer (below).


Higher reflection for each object recorded in the wavelength that corresponded to their color, i.e., blue material reflected most in the blue region (470 nm) of the spectrum.  Following the hands-on activity, WyomingView PI demonstrated how the same principle of light reflection can be applied to satellite and aerial images for monitoring water clarity of lakes.


Landsat 5 Thematic Mapper image acquired in 2011 (above) shows the spread of algal bloom in Lake Erie.  Light reflection in the lake covered by floating algae (shades of green) varies from the rest (dark blue), which can be used for monitoring water quality.

Additional details about this image and the algal bloom problem captured in it can be found at NASA's Earth Observatory website (https://earthobservatory.nasa.gov/images/76127/toxic-algae-bloom-in-lake-erie).

Thursday, June 11, 2015

Integrating Landsat images in sixth grade curricula – WyomingView article published in PE&RS

WyomingView has been working with sixth grade teachers in Laramie area schools to incorporate Landsat images for illustrating natural (flooding, wildfires) and human influences (deforestation, urbanization) on the environment and the resultant changes in the landscape. Utility of Landsat image-pairs generated by the USGS, NASA and WyomingView along with lessons learned from these activities are described in a highlight article published in the Photogrammetric Engineering & Remote Sensing [81(6):425-431 – DOI: 10.14358/PERS.81.6.425].

Link to the article [subscription to PE&RS is not required]: http://www.asprs.org/a/publications/pers/2015journals/PERS_June_2015/HTML/

Wednesday, April 15, 2015

Satellite images of lakes and reservoirs help second graders understand the value of water

Second graders in the Indian Paintbrush Elementary School (IPES) saw how satellites collect data about Earth from space and how those data are used for monitoring water bodies such as lakes and reservoirs around the world.

Students are learning about water (part of the second grade core curriculum standard) and its importance to humans, other living beings, and environment. With the help of historical and present satellite images, students were able to visualize the impact of a) diverting water from rivers made a sea disappear (Aral Sea), b) precipitation and drought on reservoirs in Wyoming, and c) runoff from crop fields and other effluents in Lake Erie and Gulf of Mexico. Students were able to see how human actions, small and big, influences water quantity and quality.

Describing the value of these images, Genee Witte, one of the second grade teachers in IPES, said, “It was very exciting and extremely helpful for the second graders to see the images ...  It helped build their background knowledge of the changes the lakes, etc. undergo. … The images of the disappearing sea and the images of the effect that pollution has on the water and us made us all take a moment to think about how we can make a difference.  … Having the images shown to the students helps them to retain the information!  They are able to keep that image in their mind and add to their background knowledge.

Julie Howard, another second grade teacher, was able to talk “about the map of the Great Lakes.  Some of them had just read a story about Paul Bunyan and how he formed these lakes. This then lead to a discussion of where water came from to fill these lakes and then looking at a map to follow the Mississippi River. We discussed how and where water flows by referring to maps.” Stacy Hoffer, who teaches the third section of second graders, commented the images were “very informative and my students enjoyed it. The presentation on water created more discussion in my classroom.

Changes occurring in the Aral Sea captivated the minds of most students. Student teacher Shawna Black commented “ [T]he students have continued to talk about the magically disappearing act of the Aral Sea, and have asked if we can look at more pictures of bodies of water to see if it affects other places since you showed us the amazing satellite images.”

Students wrote about what they learned from these talks and their responses are summarized in the following word cloud:


Sivanpillai visited these classrooms on April 1, 2 and 15, 2015, as part of the WyomingView’s Earth Observation Day (EOD) and Wyoming Center for Environmental Hydrology & Geology (WyCEHG)’s K-12 outreach activities.

Friday, December 12, 2014

Monitoring our changing environment using satellite images: Earth Observation Day activities in UW Lab School

Sixth grade students at UW Lab School saw how nature and man-made changes have altered Earth’s surface. As part of the WyomingView Earth Observation Day activity (Dec 5 and 12, 2014), sixteen students were introduced to data collection in the visible and invisible portions of the electromagnetic spectrum.

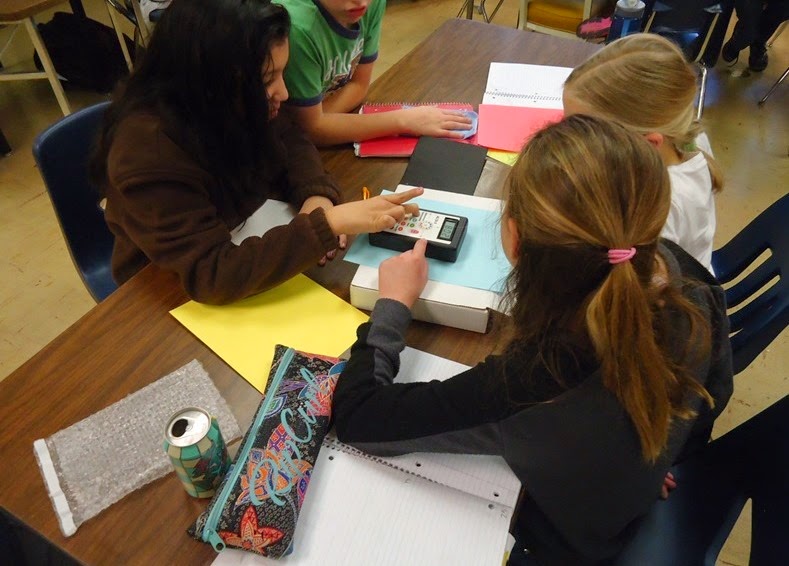
Measuring spectral reflectance of color papers using ALTA II Spectrometer

After introducing electromagnetic spectrum in his sixth grade class, Andy Pannell, invited WyomingView PI to his class for describing how scientists collect and analyze spectral data. First, students collected spectral reflectance of colored papers and compared their reflectance patterns. Students then learned that satellites collect similar data using very sophisticated and expensive sensors, and the data collected over the past several decades can be used for mapping changes in the landscape. Pannell commented that the “incredible satellite images that helped our students see the usefulness of these understandings, as well as wavelengths outside the visible spectrum, in a real-world context.”

Student feedback about remote sensing and its benefits to society are listed below (students are identified by initials for privacy purposes):

It helped me with understanding radiation because I couldn’t see what was happening but something was [happening] and it was AMAZING

Showed us how people use thermal scans to find wildfires” G

Helped me understand how using IR and UR might be helpful to find different info.” HB

Showed me that different colors reflect different amount of light” Z

Makes things look so different” SH

Those images were surprising and they helped [me] to understand electromagnetic radiation

I know that the [satellites] are really important to see our earth” SS

Showed me reflecting lights of the trees, and it also showed the bad and good ones” CD

Showed us how people use different ways to show wildfire, water shortages, bad soil etc.”

Wednesday, May 14, 2014

WyomingView interns describe how satellite data can be used for monitoring past environmental changes

Emily Richardson (BS Botany) monitored aspen tree growth in normal, wet, and dry years along an elevation gradient in the Sierra Madre Mountains. She computed a vegetation index from Moderate Resolution Imaging Spectrometer (MODIS) data acquired in 3 years and analyzed tree growth based on their phenology curves. Aspen stands growing at lower elevations exhibited major changes during these three years, whereas their growth patterns at higher elevations did not show such variations.


Ryan Lermon (BS Rangeland Ecology & Watershed Management) mapped the burn severity at a prescribed fire site north of Rawlins, WY. Prescribed fires are part of forest management methods aimed at reducing fuel load, and improving overall habitat quality. Following a prescribed fire event, land management agencies are required to map how fire moved through the landscape but lack the necessary resources to generate it. Using a Landsat 8 image acquired after the fire, Ryan mapped the impact of this prescribed fire as high, medium, low and no-burn classes. This map will be used by agencies to establish field sampling plots for monitor vegetation regrowth.


Emily and Ryan presented their work in the Wyoming Undergraduate Research Day on 26 April 2014.


Following newspapers published a short description of Emily's work:


Laramie Boomerang - May 10, 2014 - Link to article

Casper Star Tribune - May 12, 2014 - Link to article

Washington Times - May 10, 2014 - Link to article

Monday, March 31, 2014

Eighth graders associate spectral reflectance patterns with plant form, health status

Eighth grade students at Laramie Junior High School learned to measure the spectral reflectance of leaves and analyze differences based on their types (conifers vs. deciduous) and health status (live vs. dying) during presentations by Ramesh Sivanpillai, principal investigator for WyomingView. The more than 75 students also learned how sensors in remote sensing satellites collect similar data about Earth surface features.

Students providing their feedback on remote sensing concepts and the hands-on activity that aimed at comparing spectral reflectance values of live vs. dead leaves from conifer and deciduous trees.

Ron Whitman, physical sciences teacher at the school, invited Sivanpillai to four sections of his eight grade classes to highlight remote sensing science and applications. “Ramesh introduced the electromagnetic spectrum with a very informative power point presentation during class period[s,]” he said. Whitman trained students to collect spectral data of the leaves, enter them in spreadsheet, and analyze them. This year’s activities spanned four class periods. “I was able to teach, on my own, the aspects of remote sensing, collection of data, displaying data and interpreting research data as initially taught by Ramesh,” he said.

Whitman noted the students continue to be excited about remote sensing and simple and complex tools. “Students compared their own data and other students’ data and discussed what was similar, different, and reasons for error,” he said. “Ramesh came back and helped students interpret their data and compare to other practical research by colleges and college students.”

WyView coordinator discuses phenology and leaf color changes in aspen trees

Student feedback highlighted different aspects of this lecture and hands-on exercise. Students are identified by initials for privacy purposes.

"I learned that the spectral reflectance values of things make a big difference in the world." KD

"I learned that the colors that you can see are based on what colors are reflected of of the object." KW

"I have learned that plant give off infrared radiation waves. They help us tell if the plant is healthy." DR

"I learned how to graph on the excel and I learned how to use a spectrometer" MH

"I also learned how satellites check out the environment from space from all around the world ... we learned how to plot and compare reflectance values." SH

"In the hands on activity I learned how to calculate the percent of reflectance of colors." CH

"I learned that live leaves reflect more than dead leaves." NT

"We also learned how to use Microsoft Excel and how it can graph scientific data." JW

"... a live leaf absorbs more of every other color but reflects green the most." SH

"I can definitely say that I learned new information about electromagnetic radiation and how it affects the colors that are visible for different species." KW

This event was conducted on March 31, April 1, 2, 8, 9 and May 19 as part of AmericaView’s Earth Observation Day activities aimed at introducing remote sensing science and applications to K-12 students and teachers.

Friday, March 14, 2014

Conner’s aspen phenology study wins third place in the 2014 Wyoming State Science Fair

Conner Whitman, an 8th grader in Laramie Junior High School, monitored leaf color changes in 3 aspen trees for 29 weeks (May – Oct 2013) by measuring their spectral reflectance values every week.

His research focused on how age and health status of these aspen clones influenced the changes in their leaf pigments. Every week starting in the spring, he collected leaves from 2 healthy (young and old), and 1 stressed (young) aspen trees and measured the amount of light reflected in eleven different wavelengths.

For comparison he also measured light reflected by an Engelmann spruce. Most conifer trees like Engelmann spruce do not exhibit prominent leaf color changes.
Using the amount of light reflected in infrared and red portions of the spectrum he calculated the different index which can be related to the amount of leaf chlorophyll content in each tree.


His results (figure above) indicated that the rate of chlorophyll change was influenced by health status of individual aspen trees within a clone. However there was no difference between the young and old healthy aspen trees. The light reflected by Engelmann spruce steadily increased throughout the year and did not show the declining trend in fall season.


Conner presented his research findings in the 2014 Wyoming State Science Fair in Laramie on 3/4/2014 and won the third place in the Plant Sciences category.

Tuesday, March 4, 2014

Abigail’s study on the effect of rain on urban heat island wins a Certificate of Achievement from NCAR and third place in the 2014 Wyoming State Science Fair

Abigail Whitman, a 6th grader in Laramie’s Snowy Range Academy, studied how afternoon rain showers in summer altered the urban heat island effect.

Temperature data collected by her at 3 outdoor locations on 12 days revealed that concrete, grass, and asphalt surfaces rapidly cooled following PM rainfall events in comparison to non-rainy days. Temperatures of all three surfaces dropped gradually on sunny days with no rain. At the end of the day, asphalt and concrete recorded higher temperatures than grass lawns. On rainy days temperatures of these surfaces dropped rapidly following the rain event. However the pattern of temperature drop of these three surfaces did not change. Her research revealed that in addition to rain, wind and clouds also influenced the rate of decrease in temperature of these surfaces.


Abigail presented her research findings in the 2014 Wyoming State Science Fair in Laramie on 3/4/2014 and won the third place in Earth and Planetary Sciences category.  Additionally she was awarded a Certificate of Achievement from the National Consortium for Atmospheric Research (NCAR) in the Junior Geoscience division.

Friday, September 27, 2013

WyomingView sponsored students present their research findings in 2013 Geospatial Conference of the West (GeCo West) Conference


Four WyomingView sponsored students presented their research about the urban heat island effect, image analyst bias and utility of indices to map water bodies in the recently concluded 2013 GeCo West Conference in Laramie, WY. WyomingView coordinator mentored these students on these projects.


Sarah Arulswamy, a 9th grade student at Laramie Junior High School, has been studying the urban heat island effects in Laramie since summer 2012. Earlier she presented her findings based on summer, fall and winter data in the 2013 Wyoming Science Fair. She continued her study in spring 2013 and presented the findings in this conference. Urban heat island effect was evident in spring but at a much lesser magnitude than what she observed in 2012 summer (Figure below).


Bailey Terry (BS Rangeland Ecology & Watershed Management) has been estimating analyst bias introduced during Landsat image classification. She described how small differences introduced by the analysts during the interpretation process influences area estimates of earth surface features.


Kaitlyn McCollum (MS Agricultural Economics) and Matthew Thoman (BS Rangeland Ecology & Watershed Management) tested the transferability of threshold values of commonly used indices for mapping water bodies. In their talk they described how well threshold values generated for one water body can be transferred to other water bodies in space and time.


Additional photos from these presentations can be found at WyomingView’s Google+ site.

Tuesday, September 17, 2013

WyomingView workshop highlights the value of no-cost Landsat data for natural resources monitoring

WyomingView coordinator Ramesh Sivanpillai described how no-cost Landsat data can be used for monitoring and mapping natural resources in one of the several pre-conference workshops of the 2013 Geospatial Conference of the West held in Laramie, WY. Participants were introduced to remote sensing basics and data characteristics in order to provide an overview of various data sources along with various advantages of Landsat data.

Landsat data constitute the longest collection of remotely sensed earth observations. Starting 2008, the US Geological Survey (USGS) has made the entire Landsat data archive available to users at no-cost which has created an unprecedented opportunity for monitoring and mapping changes to the earth’s surface features.


Participants were introduced to similarities and differences among data collected by various Landsat satellites and how to search and download them for their area of interest from USGS’ web portal - Earth Explorer (earthexplorer.usgs.gov). More information about Landsat data can be found at: landsat.usgs.gov.

Tuesday, June 11, 2013

Researchers generate crop growth patterns for Wyoming farmlands from satellite images

Article originally published in Reflections a publication of the UW College of Agriculture and Natural Resources (Publication date: June 2013; pages 40-42)

Access the issue online at: http://www.uwyo.edu/uwexpstn/publications/reflections/reflections-2013-web.pdf (4.2MB)

* * * * * * * * * * *

Researchers generate crop growth patterns for Wyoming farmlands from satellite images

Under precision-agriculture or site-specific management practices, farmers split fields into discrete zones based upon underlying soil properties and past crop growth patterns. By dividing the field into zones, a farmer can devote more resources to zones with medium to low growth to increase output.

Remotely sensed data (images) of crop growth acquired during the growing season in multiple years are essential to understand and map differences in crop growth through time. Data collected in the infrared region (invisible to human eyes) are particularly useful to distinguish differences in crop growth in a field. 

Advances in technology are enabling us to acquire remotely sensed images using sensors mounted in balloons, unmanned aerial systems, or farm vehicles (tractors and trucks, for example). 

Images collected by Landsat satellites date back to the early 1970s and comprise the longest and one of the most complete collections of remotely sensed images. Since these images are acquired once every 16 days, farmers can use them to monitor growth patterns during one or more growing seasons. 

In 2008, the U.S. Geological Survey (USGS) opened the entire Landsat image archive free to users. Now any user can download images directly from the USGS websites http://glovis.usgs.gov or http://earthexplorer.usgs.gov. 

Infrared images acquired by a Landsat satellite show changes in crop growth during the 2007 growing season. Crops with high growth (or vigor) appear bright red due to more reflection in the infrared region. Darker shades of red indicate medium- to low-growth areas. Harvested areas and bare ground appear in shades of green and blue.


University of Wyoming students enrolled in the remote sensing for agricultural management course are taking advantage of this to monitor fields in Wyoming or their home states. 

Monitoring crop growth in one growing season

Carson Hessenthaler, agricultural business major from Lovell, compared sugar beet growth in a field near Lovell that had uneven soil fertility. Using three Landsat images acquired at different times of the year, he tracked growth in areas that showed poor, medium, and high growth at the start of the growing season (Figure 1).
Figure 1: Landsat images revealed differences in the sugar beet growth for the
2011 growing season at a farm near Lovell.
His analysis revealed that areas with high-, medium-, and poor-growth patterns at the start of the season stayed more or less same until the end of the season. However, areas with poor growth at the start had relatively more growth, albeit small, throughout the season and ultimately narrowed the gap with the other two categories. 

Mapping crop growth between growing seasons

Matthew Thoman, rangeland ecology and watershed management major from Riverton, mapped winter wheat growth patterns in non-irrigated fields east of Cheyenne. Using Landsat images acquired in April, May, and June of 2007 and 2009, he mapped winter wheat growth for the two growing seasons (Figure 2). 

Figure 2: Variations in the winter wheat growth in non-irrigated
fields near  Cheyenne in 2007 (left column) and 2009 (right column).
Each square represents 0.22 acres (900 square meters) on the ground.
Dark green to light green correspond to high to medium growth.  
Yellow and brown colors correspond to low and no growth.
Combining data from three Landsat images acquired during each growing season, he was able to see that between 2007 and 2009, the area under high growth increased from 1.3 to 5.5 acres shown in dark green (Field 1). This increase occurred mostly in areas that had medium growth in 2007. Some of the medium growth areas of 2007 had lower growth in 2009 (yellow); however, this decline was noticed along the edges.

The second field showed increases in high and medium categories and decreases in low and bare ground categories. While no part of this field was classified as high growth in 2007, four acres witnessed high growth in 2009. On the other hand, areas of low growth decreased from approximately 11 acres in 2007 to 5 acres in 2009.

These examples demonstrate how information derived from Landsat images can be used to identify areas where crop growth varies between years. Farmers and crop consultants can use this information to devise suit-able management plans for increasing crop growth.

Tracking changes through multiple years

Availability of free Landsat images provides numerous other possibilities for monitoring growth in Wyoming croplands. For example, farmers can adapt Hessenthaler’s technique and obtain images from several years to analyze crop growth prior to its maturity.