Showing posts with label Land cover changes. Show all posts

Thursday, June 11, 2015

Integrating Landsat images in sixth grade curricula – WyomingView article published in PE&RS

WyomingView has been working with sixth grade teachers in Laramie area schools to incorporate Landsat images for illustrating natural (flooding, wildfires) and human influences (deforestation, urbanization) on the environment and the resultant changes in the landscape. Utility of Landsat image-pairs generated by the USGS, NASA and WyomingView along with lessons learned from these activities are described in a highlight article published in the Photogrammetric Engineering & Remote Sensing [81(6):425-431 – DOI: 10.14358/PERS.81.6.425].

Link to the article [subscription to PE&RS is not required]: http://www.asprs.org/a/publications/pers/2015journals/PERS_June_2015/HTML/

Friday, December 12, 2014

Monitoring our changing environment using satellite images: Earth Observation Day activities in UW Lab School

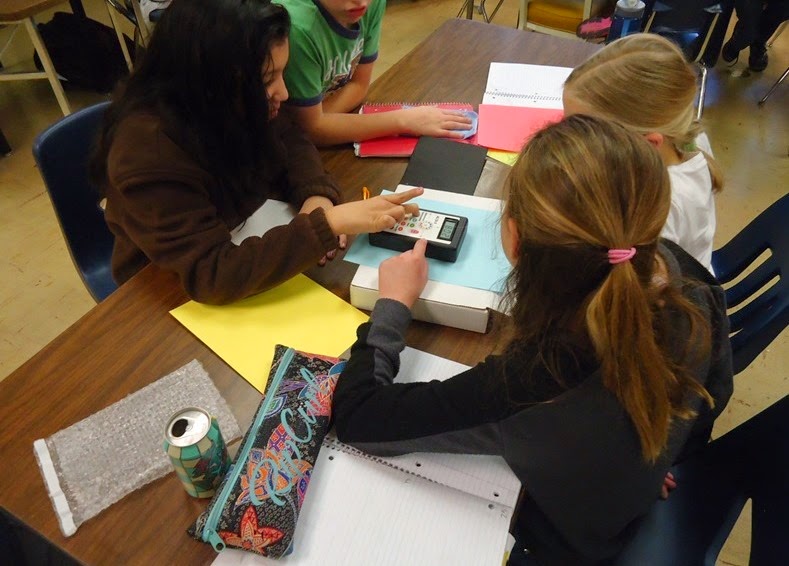
Sixth grade students at UW Lab School saw how nature and man-made changes have altered Earth’s surface. As part of the WyomingView Earth Observation Day activity (Dec 5 and 12, 2014), sixteen students were introduced to data collection in the visible and invisible portions of the electromagnetic spectrum.

Measuring spectral reflectance of color papers using ALTA II Spectrometer

After introducing electromagnetic spectrum in his sixth grade class, Andy Pannell, invited WyomingView PI to his class for describing how scientists collect and analyze spectral data. First, students collected spectral reflectance of colored papers and compared their reflectance patterns. Students then learned that satellites collect similar data using very sophisticated and expensive sensors, and the data collected over the past several decades can be used for mapping changes in the landscape. Pannell commented that the “incredible satellite images that helped our students see the usefulness of these understandings, as well as wavelengths outside the visible spectrum, in a real-world context.”

Student feedback about remote sensing and its benefits to society are listed below (students are identified by initials for privacy purposes):

It helped me with understanding radiation because I couldn’t see what was happening but something was [happening] and it was AMAZING

Showed us how people use thermal scans to find wildfires” G

Helped me understand how using IR and UR might be helpful to find different info.” HB

Showed me that different colors reflect different amount of light” Z

Makes things look so different” SH

Those images were surprising and they helped [me] to understand electromagnetic radiation

I know that the [satellites] are really important to see our earth” SS

Showed me reflecting lights of the trees, and it also showed the bad and good ones” CD

Showed us how people use different ways to show wildfire, water shortages, bad soil etc.”

Wednesday, May 14, 2014

WyomingView interns describe how satellite data can be used for monitoring past environmental changes

Emily Richardson (BS Botany) monitored aspen tree growth in normal, wet, and dry years along an elevation gradient in the Sierra Madre Mountains. She computed a vegetation index from Moderate Resolution Imaging Spectrometer (MODIS) data acquired in 3 years and analyzed tree growth based on their phenology curves. Aspen stands growing at lower elevations exhibited major changes during these three years, whereas their growth patterns at higher elevations did not show such variations.


Ryan Lermon (BS Rangeland Ecology & Watershed Management) mapped the burn severity at a prescribed fire site north of Rawlins, WY. Prescribed fires are part of forest management methods aimed at reducing fuel load, and improving overall habitat quality. Following a prescribed fire event, land management agencies are required to map how fire moved through the landscape but lack the necessary resources to generate it. Using a Landsat 8 image acquired after the fire, Ryan mapped the impact of this prescribed fire as high, medium, low and no-burn classes. This map will be used by agencies to establish field sampling plots for monitor vegetation regrowth.


Emily and Ryan presented their work in the Wyoming Undergraduate Research Day on 26 April 2014.


Following newspapers published a short description of Emily's work:


Laramie Boomerang - May 10, 2014 - Link to article

Casper Star Tribune - May 12, 2014 - Link to article

Washington Times - May 10, 2014 - Link to article

Tuesday, September 17, 2013

WyomingView workshop highlights the value of no-cost Landsat data for natural resources monitoring

WyomingView coordinator Ramesh Sivanpillai described how no-cost Landsat data can be used for monitoring and mapping natural resources in one of the several pre-conference workshops of the 2013 Geospatial Conference of the West held in Laramie, WY. Participants were introduced to remote sensing basics and data characteristics in order to provide an overview of various data sources along with various advantages of Landsat data.

Landsat data constitute the longest collection of remotely sensed earth observations. Starting 2008, the US Geological Survey (USGS) has made the entire Landsat data archive available to users at no-cost which has created an unprecedented opportunity for monitoring and mapping changes to the earth’s surface features.


Participants were introduced to similarities and differences among data collected by various Landsat satellites and how to search and download them for their area of interest from USGS’ web portal - Earth Explorer (earthexplorer.usgs.gov). More information about Landsat data can be found at: landsat.usgs.gov.

Wednesday, September 19, 2012

WyomingView conducts workshop highlighting the utility of Landsat data for natural resources monitoring

WyomingView coordinator Ramesh Sivanpillai conducted a workshop at the Cable Center in Denver, CO as part of the 2012 GIS in the Rockies Conference, highlighting remote sensing concepts and the utility of Landsat data for natural resources monitoring.  This workshop introduced GIS professionals to the characteristics of remotely sensed data and how they are collected.  Participants learned how each task required data at appropriate spatial, spectral and temporal resolutions, and the consequences of working with inappropriate data.


In the second part of the workshop, participants learned about the Landsat archive and the value of earth observation data spanning over 40+ years.  Sivanpillai explained the data characteristics of the five Landsat satellites (1-5 and 7), and how these data sets can be used for monitoring changes in the surface of the earth.  Landsat images were used to demonstrate how seasonal, annual, and long-term changes can be monitored and quantified.  Participants learned to browse and download Landsat data from GloVis (glovis.usgs.gov) – a USGS web portal.

Participants were asked to describe how they plan to use Landsat data in their future work.  One of the participants said “After this workshop, I realize that I can use Landsat for my future work in vegetation surveys … Interestingly I also realized that Landsat can be used for business, real estate, development etc.”  Another participant, a University of Northern Colorado student said “…useful when writing geographic papers (in fact before and after map)”.  While others mentioned that they planned to use Landsat data for mapping invasive species, threats to archeological resources, and avalanche forecasting.

This WyomingView educational outreach activity was conducted on 19 September 2012 (http://www.gisintherockies.org/GISITR2012/Workshops/Workshops.aspx).

Thursday, June 7, 2012

Landsat images help UW Lab School students learn about Africa’s natural diversity and environmental issues

With the help of Landsat images, 17 seventh and eighth grade students learned about Africa’s immense natural resource diversity and some of its environmental problems. Tim Blum and Cady McClurg, social science teachers, wanted to introduce their students “to the idea that a study of Africa ought not to dwell on the concept of the circle of life” as popularized in Hollywood movies.  However, they did not want students “locked into the concept that Africa is just one disaster after another.”

Students saw how large, mechanized wheat farms near the Masai Mara National Reserve (Kenya) reduced the natural grasslands that are crucial habitats for wildebeests; increasing population have cleared all but 1,500 acres of the original 250,000 acres of intact forest (Rwanda) and converted them to tea plantations; agricultural operations have expanded 10-fold in the Dakhla Oasis region (Egypt) that rely on waters from deep aquifers that cannot be easily recharged;  how 34 years of Kampala’s growth (Uganda) impacted adjacent forests and wetlands resulting in eutrophication of lakes (figure); growth of Moroccan cities along the Atlantic coastline; and how construction of dams resulted in less inflow and more aquatic plants in Ichkeul Lake (Tunisia).  Commenting on the value of these images Tim said “[they] helped my students grasp the idea that Africa is a very diverse continent.”

Landsat Images (the longest operating satellite remote sensing program) in this presentation were obtained from USGS and NASA websites (agencies jointly responsible for operating Landsat satellites).

These images contain a wealth of information that can be a valuable teaching resource used for to educate students about the environment and the changes caused by nature and humans.

This outreach activity was conducted on 22 May 2012 by WyomingView coordinator Ramesh Sivanpillai as part of AmericaView’s Earth Observation Day activities aimed at introducing teachers and students to remote sensing science and applications.

Image sources:
USGS: http://landsat.usgs.gov/gallery.php
NASA: http://landsat.gsfc.nasa.gov/image

Monday, May 21, 2012

UW Students Research Value of Satellite Images for Monitoring Wyoming Resources

Source: UW Extension Service's press release
By: Steven L. Miller, Senior Editor
Date: 21 May 2012


Students at the University of Wyoming found that aspen had budded earlier in a drought year, and that surface area estimates from satellite images matched well with corresponding water levels in Woodruff Narrows Reservoir near Evanston. Other students used information derived from remotely sensed images to monitor crop growth on a southeast Wyoming wheat farm and the effects of the 2004 Basin Draw fire in northeast Wyoming. The research taught students how to use satellite images and its effectiveness.

Every spring semester, three to five students -- in the Department of Ecosystem Science and Management in the UW College of Agriculture and Natural Resources -- conduct research using remotely sensed data on a topic of their interest, says Ramesh Sivanpillai, research scientist in the Wyoming Geographic Information Science Center. He teaches the college's digital image processing for natural resources management course.

"Most of these students select the farms or ranches owned by family members or forests and public land they have worked on during summer months," he says. "Familiarity about their study areas provides them a unique advantage when analyzing and interpreting satellite images, and for conveying the findings of their study to the landowners or agencies."

Matthew Thoman of Riverton worked on a dryland winter wheat farm east of Cheyenne and was familiar with the fields. By processing Landsat images from the growing seasons of 2007 and 2009, he found growth variations within fields -- despite higher soil moisture levels in 2009 than 2007.

He will share the information with the producer, who could devise plans to correct the deficiencies, Sivanpillai says.

Brandt Schiche of Buffalo used Landsat images to glean information about surface area changes on Woodruff Narrows Reservoir. Water from the reservoir is used for irrigation, recreation and industry, and is shared between Utah and Wyoming.

"He found a significant relationship between the surface area estimates derived from Landsat images and the corresponding water levels in the reservoir," Sivanpillai says.

Jason Pindell of Wheatland used MODIS (Moderate Resolution Imaging Spectroradiometer) data to assess differences in the growing pattern of aspen stands in the Medicine Bow National Forest. His research showed aspen put out leaves relatively earlier (bud-burst) in a drought year (2002) in comparison to the bud-burst in a normal year (2009).


Orin Hutchinson of Newcastle (pictured above) had worked with the U.S. Forest Service managing wildfires. He evaluated indices derived from Landsat images that highlighted burned (immediately) and revegetated (few years later) areas after the 2004 Basin Draw fire northwest of Aladdin in Crook County. The fire burned more than 4,500 acres in three days, but its impact and severity varied throughout the landscape.

"His results pointed out that burn severity index values were in good agreement with the data collected in the field," Sivanpillai says. "However, extraneous factors, such as precipitation and management practices, influenced the vegetation regrowth, limiting the effectiveness of satellite data for monitoring regrowth after several years."

Students presented their findings during UW's recent Undergraduate Research Day.

###

Monday, May 14, 2012

Sixth graders learn the value of satellite images for highlighting changes in urban areas and water bodies

Fifty-one students at Laramie Junior High School (LJHS) saw how satellite images collected since the 1970s can be used to monitor changes in cities and water bodies such as rivers and lakes. In Jared Long’s social science class, students are learning about urban growth and changes in water bodies caused by natural processes and human actions. In particular, they were comparing these changes in developed, developing and under-developed countries.

WyomingView coordinator Ramesh Sivanpillai described how satellites and aircraft are used to acquire these birds-eye images.  Using images acquired by Landsat and TERRA satellites, he demonstrated the growth of cities in the U.S., Mexico, Uganda and middle-East. These images were acquired 10-30 years apart. Students saw how cropland and forests were converted to urban areas to accommodate urban growth. Students also saw the video created by NASA that showed the yearly expansion of Las Vegas from 1974 – 2011. This video highlighted the mushrooming of Las Vegas and the addition of subdivisions, golf-courses and commercial areas. Satellite images also showed the new dams and reservoirs, changes in their water storage over time, and impacts of catastrophic events, such as flooding, can have on cities.


“Our students greatly benefited from this presentation” said Jared Long, social science teacher LJHS. “The presentation had been tailored to topics that have been addressed in our class over the course of the year, specifically how water bodies and urban areas change over time … our students' knowledge and engagement with these topics increased substantially.”

This outreach activity was conducted as part of AmericaView’s Earth Observation Day activities aimed at introducing teachers and students to remote sensing science and applications.

Wednesday, April 4, 2012

2010 FLOODING: LARAMIE, WYO.

The Laramie River topped its banks in June 2010 Albany County as a result of snowmelt, flooding several streets and parks in the City of Laramie (more information on Laramie Boomerang). City’s Greenbelt and several properties were severely impacted as a result of this flooding event. Albany County Emergency Management personnel had to divert water upstream of Laramie to protect properties in the city.


Data collected by Thematic Mapper on the Landsat 5 satellite on 21 June 2010 (above) shows the extent of flooding (water appears black in color). Laramie River appears as a narrow, meandering feature in the 29 June 2007 (normal flow) image also acquired by Landsat 5.

Data collected by Landsat and other moderate resolution satellites can be used to gain insights about past flooding patterns and devise plans to minimize the impacts of future floods.

Landsat satellites are jointly managed by USGS (http://landsat.usgs.gov/) and NASA (http://landsat.gsfc.nasa.gov/).

Monday, March 19, 2012

URBAN GROWTH: CHEYENNE, WYO.

In 1867, when it was granted a permanent city charter by the Dakota Territory legislature the City of Cheyenne was home to approximately 600 people. In 2010 its population was nearly 60,000 a 100-fold increase.

Data collected by Thematic Mapper sensor (on the Landsat 5 satellite) in 1985 (1980 Pop: 47,283) and 2011 (2010 Pop: 59,466) shows Cheyenne’s growth over 26 years. Highways I-80 and I-25 cross each other in southwest Cheyenne. Most of the growth has occurred in the northern and northeastern parts of the city. Green tones correspond to vegetation such as trees, shrubs, grasses, and croplands.


Ongoing construction activities are visible in the eastern side (County Fairgrounds) and southwest side (industrial complex) of the 2011 image. Change detection using imagery can help us understand the past and better plan for the future.

The Landsat 5 satellite was launched by NASA and operated by USGS for monitoring earth’s surface.

Sources: USGS (http://landsat.usgs.gov/) and Wyoming's Economic Analysis Division (http://eadiv.state.wy.us/demog_data/cntycity_hist.htm)

Thursday, March 1, 2012

Using satellite images 5th and 6th grade students in UW Lab School learn about human impact on environment

With the help of satellite images fifth and sixth grade students at Mr. Tim Blum’s geography class (photo above) at the UW Lab School (31 January 2011) got a birds-eye view of how humans have impacted or modified their environments.  Images acquired by satellites decades apart showed cleared forests, irrigated crop fields in the middle of the deserts, altered landscapes (new roads and water bodies), and urban growth. 

As part of the Earth Observation Day (EOD) activities, WyomingView coordinator Ramesh Sivanpillai described the utility of images acquired by satellites are useful for monitoring changes on earth’s surface.   

For example, Landsat images acquired in 2000 (bottom left) and 2009 (bottom right) shows the newly constructed roads, drilling pads, and ponds for an area within the Powder River Basin.


The goal of EOD activities is to introduce teachers and students to remote sensing science and technology and is promoted by AmericaView.  Sivanpillai works with individual teachers in Laramie-area schools and develops remote sensing course materials that relate to the topics taught to students.

Blum and his student teachers introduced students to the human impact on the environment.  The remote sensing “presentation fit with our curriculum and the students were captivated,” Blum commented.  “Your presentation certainly made an impression on our students because the information you provided was referenced in several discussions that occurred later in our unit.”  Tailoring materials to individual class needs increases student engagement and learning.

Tuesday, April 5, 2011

Laramie Junior High School Students learn about Remote Sensing Science and Career Opportunities

Infrared images acquired by Landsat
shows active fires "through-the-smoke".
Images acquired in human visible
region will be "covered with smoke".
One hundred and two students in Mr. Ron Whitman’s eighth (physical sciences) and seventh (biological sciences) grade classes (three class periods each on April 5th and 6th 2011) learned how remotely sensed data collected in different regions of the electromagnetic radiation (EMR) are used for looking at changes on the surface of the earth.

WyomingView coordinator Ramesh Sivanpillai showed satellite and aerial images collected in the visible region (for human beings) and beyond (infrared) and their utility for monitoring the surface of earth and the changes occurring in it.  Examples included monitoring water quality, deforestation, and wildfire damages (see Landsat images acquired during and after a wildfire event in Wyoming).

The post-fire infrared images acquired
by Landsat shows both the extent
and severity of the wildfire. US
Forest Service and other federal agencies
use Landsat and similar images for
assessing burn severity classes.
“Identifying the practical applications of remote sensing and how physical science concepts are used in remote sensing has been very beneficial to my class” commented Mr. Whitman.“Using different electromagnetic waves other than visible light to make observations is always intriguing to my class” he added.


Sivanpillai also discussed career opportunities in remote sensing and how students can academically prepare for them.  “Many students see the occupation opportunities involved with this field, especially the potential to travel and view many other geographic areas” said Mr. Whitman.  “Having professionals visit my classroom or going to their occupation site always motivates my students to try a little harder in my academically rigorous class”.


This educational outreach activity was conducted on April 5th and 6th (6 individual talks) as part of AmericaView’s Earth Observation Day activities aimed at introducing teachers and students to remote sensing science and applications.

Tuesday, February 22, 2011

Satellite Images show how Humans Impact their Environment: Earth Observation Day Event at Slade Elementary School


Sixth graders at Slade Elementary School (SES) saw how remotely sensed images collected by satellites orbiting the earth can be used for monitoring how humans are impacting their environment.  Students in Mr. Jared Long's and Mr. Andy Pannell's classes were learning about how humans are modifying their environment through their activities.

Mr. Pannell (left) and Mr. Long (right), 6th grade teachers
at Slade Elementary School, Laramie Wyoming.
Using satellite images acquired at different times, WyomingView coordinator Ramesh Sivanpillai highlighted human-made changes in different parts of the world.

For example, Landsat images showed how agriculture activities have expanded in Namibia, deforestation in Brazil and Rwanda, urban growth in Pearl River Delta (China), and Dubai, and shrimp farming in Ecuador.

Sivanpillai described the long history of remote sensing and the different platforms (pigeons, balloons, airplanes and satellites) that were used for collecting images in the visible and invisible (infrared) parts of the electromagnetic spectrum.

Student responses were "Learned a lot about earth (Zach)", "Different views of leaves! Really cool (Brianna)", "Change over time on earth very interesting (Liz)", "Wildfire pictures (Tamer)", and "very interesting, informative (Phoenix)", when asked "what stuck out" most from this presentation.  Mr. Long commented that "students and I really enjoyed" the presentation.


This outreach activity was conducted on February 22, 2011 as part of AmericaView’s Earth Observation Day activities aimed at introducing teachers and students to remote sensing science and applications.

Thursday, September 16, 2010

WyomingView interns present their research findings in the 2010 GIS in the Rockies Conference

WyomingView interns (spring 2010 semester) Paul Arendt and William (Bill) Gray presented their research findings in the 23rd annual GIS in the Rockies Conference in Loveland, CO.


Using Landsat images Paul Arendt (BA Geography) analyzed the spectral reflectance patterns of areas impacted by the Mountain pine beetle in the Medicine Bow National Forest, Wyoming.  He combined Landsat observations with aerial survey data collected by the US Forest Service to identify differences in the reflectance patterns of beetle infected (n=77) and non-infected (n=50) areas. He calculated Normalized Difference Vegetation Index (NDVI) and Tasseled Cap Wetness Index for these sites and found that both indices had lower values at affected sites and these differences were statistically significant (p < 0.01). Within the 77 beetle infected sites, the mean NDVI and Tasseled Cap wetness values were higher (p < 0.01) in the patchy lower forest (< 2567 m) in comparison to the subalpine lodgepole pine (>2568 m) forest.  Describing the value of this research, Paul commented "...this project served as an excellent introduction to the process of scientific research".

Bill Gray (MA Planning) used Landsat images acquired from 1984 through 2009 to map changes in the surface area of Ocean Lake in Freemont County, Wyoming. Using images acquired in spring and fall for 27 years, he mapped changes in the surface area and compared the within- and between-year variations.  His findings revealed that the lake's surface area in spring (2442 hectares) was less in comparison to the surface area in fall or autumn (2457 hectares).  The overall area showed a declining trend from 2536 ha (fall 1986) to 2392 ha (fall 2009).

Both studies were possible due to the availability of no-cost Landsat data.  Prior to the no-cost Landsat data era, purchasing 54 images that Bill Gray used in his study, would have cost him US$ 35,000 which would be beyond the reach of any graduate student.  "A unique aspect of this study is that it offers the end-user a technique to use the free archive of LandSat images in a time series for analysis..." said Bill Gray.

Every semester WyomingView offers internships to UW undergraduate and graduate students to work on projects that use remotely sensed data for addressing natural resource management issues in Wyoming.