Showing posts with label Earth Observation Day. Show all posts

Friday, February 27, 2026

Satellite images track global vegetation responses to annual changes to amount of sunlight

 8th graders at Laramie Middle School, as part of MS-ESS-1 content, learned how earth’s tilt, its spin and orbit around the sun causes variations in the amount of sunlight throughout the year and how various lifeforms have adapted to these changes (leaf color changes, migration, hibernation, etc.).


In this outreach activity, students learned how the information collected by sensors mounted on stationary towers, planes, and satellites are used for tracking those changes. Satellite images acquired throughout the year showed the seasonal changes to the amount of green up in the northern and southern hemispheres (figure below). Students gathered the amount of sunlight received in Cheyenne, Wyoming and compared it to another city in the Southern Hemisphere.

Courtesy: NASA Goddard's Scientific Visualization Studio
(Public domain)

Jared Krysl and Joshua Peterson, eighth grade science teachers commented “[This activity] helped to solidify the concepts brought up by our standard as it related to the amount of sunlight in a day and the formation of seasons due to the Earth’s tilt.”

This educational outreach activity was conducted on Feb 26 and 27, at Laramie Middle School, WY.

Friday, May 5, 2023

Satellite images illustrate human influence on the environment – Story of Shrinking Aral Sea

Satellite images showed fifth graders at Spring Creek Elementary School how human actions have converted one of the largest lakes in Asia to the newest desert. Diverting waters from two rivers for agriculture reduced the inflows, increased the salinity of remaining water, caused wildlife to disappear, and created the newest desert in Central Asia.

A pair of satellite images from 1964 (Corona) and 2018 (Terra) show the effect of diverting water from the two rivers flowing into Aral Sea. Satellite images courtesy of NASA Earth Observatory

A 1964 photo from the Corona satellite, several Landsat images from 1970s to 2000s, and annual MODIS images from 2000 showed how the Aral Sea, once the 4th largest inland water body, gradually shrunk exposing most of the sand. Some of these images also showed how dust storms transported large amounts of this sand to various regions across Asia and beyond.

Students were able to see how human actions can make a large lake disappear. Commenting on the value of these images for illustrating human influence on our environment, Mrs. Hayden, their teacher said, “when we discussed what the students learned/remembered from [the] presentation this week, they had lots of takeaways about how the 4 different Earth systems interact and how humans have influenced the environment.” The content included as part of this activity was “closely aligned with the standard we have been focused on”, said Hayden.

This event was conducted on April 28 at Spring Creek Elementary School, Laramie, WY.

Landsat images can be obtained for no-cost from US Geological Survey. More details about Landsat can be obtained from: https://www.usgs.gov/landsat-missions.

Monday, April 24, 2023

Earth Observation Day Event Shows Monitoring Natural Disasters with Satellite Images

Seventh graders in Laramie Middle School (LMS) learned the value of satellite images for monitoring natural disasters. 

Students are learning about natural disasters and how they are impacting humans and their environment. Images acquired before- and after- the floods, wildfires, landslides, earthquakes, etc. from Landsat and other Earth observation satellites showed the extent of damages caused by disasters.

One of the teachers commented "students were able to really take in what damage can be done from the several disasters you shared with them and how, depending on the event, the satellite imaging can provide different forms of information needed."

One hundred and fifty eight students and 2 teachers participated in 6 sessions of this Earth Observation Day activity conducted on April 24, 2023.

Wednesday, April 12, 2023

Introducing Wyoming Geography with Landsat Image Mosaic

WyomingView showcased large Landsat floor puzzle in Wyoming State Museum's monthly outreach activity in Cheyenne, Wyo. 

Assembling the puzzle, elementary school aged kids and their parents saw the diverse landscapes of the state. Further details in UW press release: https://www.uwyo.edu/uw/news/2023/04/large-landsat-puzzle-created-by-uw-researcher-introduces-wyomings-geography-to-children.html 


Monday, September 28, 2020

WyomingView's First Virtual Earth Observation Day Outreach @ Spring Creek Elem. School

Landsat images acquired in2019 show
algal blooms in Keyhole Res. Wyo. These
blooms form under abundant sunlight,
temperature and nutrients. Landsat images
are available from US Geological Survey.


Third graders in the Spring Creek Elementary School (Laramie, WY) learned how satellite images are used for tracking algal blooms in waterbodies throughout the US.

Students in 3rd grade GATE science class are learning about water and sources of water pollution. Currently they are finding solutions to address environmental issues such as oil spills, acidic conditions, and harmful algal blooms. 

First, students learned the sources of chemicals that would eventually become the nutrients for the algae once they enter waterbodies. Algal blooms appear when there is an abundance of sunlight and higher temperatures. 

Next, they saw how algal blooms appear in images captured by Landsat and other satellites. Aerial and satellite images provided by USGS, NASA, and several state environmental agencies were used for this outreach event. These satellite images showed algal blooms in small and large waterbodies throughout the US. 

Describing the value of this outreach activity, Ms. Natalie Davis, their teacher commented “provided students with real life data and imaging that brought all the work we did in class.  Students were able to see real examples of the impact water pollution has, and tie that back to what they had been testing/studying in class the weeks prior”. 

This outreach event was conducted virtually on Sept 23, 2020 due to COVID-19 restrictions.

Thursday, June 11, 2015

Integrating Landsat images in sixth grade curricula – WyomingView article published in PE&RS

WyomingView has been working with sixth grade teachers in Laramie area schools to incorporate Landsat images for illustrating natural (flooding, wildfires) and human influences (deforestation, urbanization) on the environment and the resultant changes in the landscape. Utility of Landsat image-pairs generated by the USGS, NASA and WyomingView along with lessons learned from these activities are described in a highlight article published in the Photogrammetric Engineering & Remote Sensing [81(6):425-431 – DOI: 10.14358/PERS.81.6.425].

Link to the article [subscription to PE&RS is not required]: http://www.asprs.org/a/publications/pers/2015journals/PERS_June_2015/HTML/

Wednesday, April 15, 2015

Satellite images of lakes and reservoirs help second graders understand the value of water

Second graders in the Indian Paintbrush Elementary School (IPES) saw how satellites collect data about Earth from space and how those data are used for monitoring water bodies such as lakes and reservoirs around the world.

Students are learning about water (part of the second grade core curriculum standard) and its importance to humans, other living beings, and environment. With the help of historical and present satellite images, students were able to visualize the impact of a) diverting water from rivers made a sea disappear (Aral Sea), b) precipitation and drought on reservoirs in Wyoming, and c) runoff from crop fields and other effluents in Lake Erie and Gulf of Mexico. Students were able to see how human actions, small and big, influences water quantity and quality.

Describing the value of these images, Genee Witte, one of the second grade teachers in IPES, said, “It was very exciting and extremely helpful for the second graders to see the images ...  It helped build their background knowledge of the changes the lakes, etc. undergo. … The images of the disappearing sea and the images of the effect that pollution has on the water and us made us all take a moment to think about how we can make a difference.  … Having the images shown to the students helps them to retain the information!  They are able to keep that image in their mind and add to their background knowledge.

Julie Howard, another second grade teacher, was able to talk “about the map of the Great Lakes.  Some of them had just read a story about Paul Bunyan and how he formed these lakes. This then lead to a discussion of where water came from to fill these lakes and then looking at a map to follow the Mississippi River. We discussed how and where water flows by referring to maps.” Stacy Hoffer, who teaches the third section of second graders, commented the images were “very informative and my students enjoyed it. The presentation on water created more discussion in my classroom.

Changes occurring in the Aral Sea captivated the minds of most students. Student teacher Shawna Black commented “ [T]he students have continued to talk about the magically disappearing act of the Aral Sea, and have asked if we can look at more pictures of bodies of water to see if it affects other places since you showed us the amazing satellite images.”

Students wrote about what they learned from these talks and their responses are summarized in the following word cloud:


Sivanpillai visited these classrooms on April 1, 2 and 15, 2015, as part of the WyomingView’s Earth Observation Day (EOD) and Wyoming Center for Environmental Hydrology & Geology (WyCEHG)’s K-12 outreach activities.

Friday, December 12, 2014

Monitoring our changing environment using satellite images: Earth Observation Day activities in UW Lab School

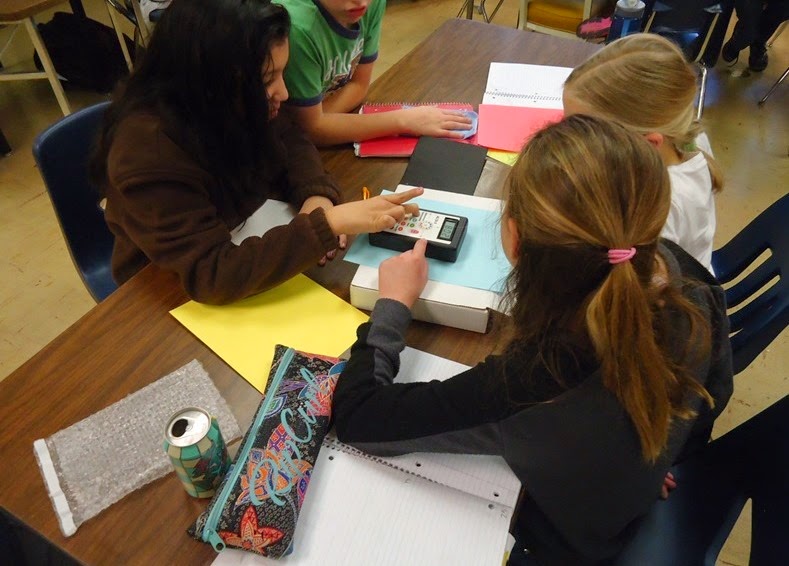
Sixth grade students at UW Lab School saw how nature and man-made changes have altered Earth’s surface. As part of the WyomingView Earth Observation Day activity (Dec 5 and 12, 2014), sixteen students were introduced to data collection in the visible and invisible portions of the electromagnetic spectrum.

Measuring spectral reflectance of color papers using ALTA II Spectrometer

After introducing electromagnetic spectrum in his sixth grade class, Andy Pannell, invited WyomingView PI to his class for describing how scientists collect and analyze spectral data. First, students collected spectral reflectance of colored papers and compared their reflectance patterns. Students then learned that satellites collect similar data using very sophisticated and expensive sensors, and the data collected over the past several decades can be used for mapping changes in the landscape. Pannell commented that the “incredible satellite images that helped our students see the usefulness of these understandings, as well as wavelengths outside the visible spectrum, in a real-world context.”

Student feedback about remote sensing and its benefits to society are listed below (students are identified by initials for privacy purposes):

It helped me with understanding radiation because I couldn’t see what was happening but something was [happening] and it was AMAZING

Showed us how people use thermal scans to find wildfires” G

Helped me understand how using IR and UR might be helpful to find different info.” HB

Showed me that different colors reflect different amount of light” Z

Makes things look so different” SH

Those images were surprising and they helped [me] to understand electromagnetic radiation

I know that the [satellites] are really important to see our earth” SS

Showed me reflecting lights of the trees, and it also showed the bad and good ones” CD

Showed us how people use different ways to show wildfire, water shortages, bad soil etc.”

Monday, March 31, 2014

Eighth graders associate spectral reflectance patterns with plant form, health status

Eighth grade students at Laramie Junior High School learned to measure the spectral reflectance of leaves and analyze differences based on their types (conifers vs. deciduous) and health status (live vs. dying) during presentations by Ramesh Sivanpillai, principal investigator for WyomingView. The more than 75 students also learned how sensors in remote sensing satellites collect similar data about Earth surface features.

Students providing their feedback on remote sensing concepts and the hands-on activity that aimed at comparing spectral reflectance values of live vs. dead leaves from conifer and deciduous trees.

Ron Whitman, physical sciences teacher at the school, invited Sivanpillai to four sections of his eight grade classes to highlight remote sensing science and applications. “Ramesh introduced the electromagnetic spectrum with a very informative power point presentation during class period[s,]” he said. Whitman trained students to collect spectral data of the leaves, enter them in spreadsheet, and analyze them. This year’s activities spanned four class periods. “I was able to teach, on my own, the aspects of remote sensing, collection of data, displaying data and interpreting research data as initially taught by Ramesh,” he said.

Whitman noted the students continue to be excited about remote sensing and simple and complex tools. “Students compared their own data and other students’ data and discussed what was similar, different, and reasons for error,” he said. “Ramesh came back and helped students interpret their data and compare to other practical research by colleges and college students.”

WyView coordinator discuses phenology and leaf color changes in aspen trees

Student feedback highlighted different aspects of this lecture and hands-on exercise. Students are identified by initials for privacy purposes.

"I learned that the spectral reflectance values of things make a big difference in the world." KD

"I learned that the colors that you can see are based on what colors are reflected of of the object." KW

"I have learned that plant give off infrared radiation waves. They help us tell if the plant is healthy." DR

"I learned how to graph on the excel and I learned how to use a spectrometer" MH

"I also learned how satellites check out the environment from space from all around the world ... we learned how to plot and compare reflectance values." SH

"In the hands on activity I learned how to calculate the percent of reflectance of colors." CH

"I learned that live leaves reflect more than dead leaves." NT

"We also learned how to use Microsoft Excel and how it can graph scientific data." JW

"... a live leaf absorbs more of every other color but reflects green the most." SH

"I can definitely say that I learned new information about electromagnetic radiation and how it affects the colors that are visible for different species." KW

This event was conducted on March 31, April 1, 2, 8, 9 and May 19 as part of AmericaView’s Earth Observation Day activities aimed at introducing remote sensing science and applications to K-12 students and teachers.

Tuesday, May 14, 2013

Students saw value of satellite images for monitoring, mapping water bodies

Sixth grade students at Laramie Junior High School saw how remotely sensed images are used for monitoring changes in water bodies around the world. Students took virtual tours of how countries manage their water resources by building reservoirs, diverted water from Rivers, and how their impact on already existing water bodies.


Jerod Long, the Social Studies/Science teacher at the 6th Grade Academy, commented "As a teacher of social studies and science, I am constantly seeking instructional techniques that allow my students to understand the interdisciplinary nature of any given topic. 

Our sixth graders are currently in the middle of a unit on water, in which we have been looking at issues revolving around distribution, consumption, water quality, implications for wildlife, implications for human beings, etc. When Ramesh approached me about giving a talk on water-related issues, I jumped at the opportunity: Ramesh brings a unique combination of real-world experience and scientific knowledge that my students benefit tremendously from. 

Ramesh recently gave a talk on water to my 6th graders that seamlessly integrated the many facets of this topic that we have been studying in class. Not only did my students gain a wealth of knowledge from this presentation, they were highly entertained and engaged. The story (ies) that Ramesh was able to tell utilizing aerial photography, digital animations and a well-crafted presentation really piqued an interest with my students."

This event was conducted on April 25 as part of AmericaView’s Earth Observation Day activities aimed at introducing teachers and students to remote sensing science and applications. Sixty students from two sessions and three teachers of the sixth grade academy participated in this event.

Friday, April 12, 2013

Eighth graders measure and analyze the spectral reflection pattern of live and dead plant leaves

Fifty-seven, eighth grade students at Laramie Junior High School learned how earth surface objects interact in the visible and invisible regions of the electromagnetic spectrum (light) and measured and analyzed spectral properties of live and dead plant leaves.

Students in the first batch are
collecting spectral data (Apr 2, 2013)
Describing the value of this hands-on exercise, Mr. Ron Whitman, eighth grade physical sciences teacher, said, “[M]y approach to teaching science has always been having the students experience the practical applications of science. Ramesh Sivanpillai from the University of Wyoming in Laramie has been presenting information about remote sensing to my classes for several years.  My 8th grade physical science class is an introductory class for physics and chemistry. One of the topics discussed is electromagnetic waves. Ramesh presented information to my classes for two, 90 minutes sessions. Ramesh introduces the electromagnetic spectrum with a very informative power point presentation. Most of the two 90 minute sessions the students get to use … spectrometers to measure and eventually calculate the percent reflectance of particular wavelengths emitted by dead vs. living deciduous leaves and dead vs. living coniferous needles. This year the students got to plot their data on a computer spreadsheet and have the program calculate and graph the data. Wow! This was awesome. Students compared their own data and other student’s data and discussed what was similar, different and reasons for error. In my assessment of the two 90 minute sessions my students continue to be excited about remote sensing and the tools, both simple and complex, that are able to detect different frequencies of the electromagnetic spectrum.”

Students in one of the three classes are entering their data in spreadsheet
to calculate and graph reflectance values of live and dead leaves (Apr 10, 2013)
Students’ feedback highlighted different aspects of this lecture and hands-on exercise (NOTE: for privacy, students are identified by their initials):

Verifying that all numbers were entered correctly
(Class period 3: Apr 10, 2013)
This experiment helped to understand chapter 6 by showing how the colors change…” - DG
This helped me understand color more. The effects of man can affect earth so much.” – CM
It helped me understand that not all light is visible to us as humans. It helped me understand that nothing has a true color it is just what color we see it in, how our eyes work.” - HS
This hands-on exercise helped me understand colors and the interaction of radiation and it was fun.”- NM
This exercise taught me that different colors reflect different amounts of light, and dead and live deciduous and coniferous trees do too.” – MS
This hands-on exercise helped me to understand the interaction of electromagnetic radiation better because we had the chance to look at real results and also examples. I learned a lot.” – LC
This activity helped me to understand how things may differ in a way we may not be able to understand at first glance. I also learned how to use Excel.” – BC
“…I learned about all the actual colors of things like leaves and flowers. This experiment was really enjoyable.” – IW
This helped because after doing the hands-on activities and seeing them in the graph compared to everyone else, I saw and understood how light reflects and how the basics of remote sensing works.” – TN
This hands-on exercise helped me to understand the interaction of electromagnetic radiation by showing me that it is used in everyday life by a lot of different careers. It was interested and showed me science is more than formulas.” – AM
This event was conducted on April 2, 3, 9 and 10 as part of AmericaView’s Earth Observation Day activities aimed at introducing teachers and students to remote sensing science and applications.

Tuesday, September 25, 2012

Laramie middle- and high-school students’ work showcased in 2012 AmericaView Fall Technical Meeting

Posters prepared by Laramie K-12 students on display in the main 
atrium of the USGS EROS Data Center, Sioux Falls, SD


Three K-12 students from Laramie had a busy summer measuring surface temperatures of natural and man-made features and the spectral reflectance values of leaves. These research activities were part of WyomingView's Earth Observation Day activities. Their findings were showcased in the 2012 AmericaView Fall Technical Meeting in Sioux Falls, SD.


Arundathi Nair, an 5th grader in the Spring Creek Elementary School explored whether man-made surfaces (roads and concrete pavement) were hotter than a natural surface (grass lawn).  Her measurements taken at 10 am, 1 pm, and 6 pm revealed that temperature of all surfaces rose to their maximum values at 1 pm.  The temperature of the road was higher than that of concrete pavement.  Grass surface had the lowest temperature, which led her to conclude that man-made surfaces were hotter than natural surfaces.


Tire mulch mat installed in this park recorded an
average temperature of 65°C (150 °F) at noon, while the
average temperature of the grass lawn and concrete
pavement were 
34°C and  25°C respectively
Sarah Arulsamy, an 8th grader in the Laramie Junior High School was also interested in how different urban features absorbed radiation at different times of the day.  She measured the surface temperature of concrete sidewalks, grass lawns, asphalt roads and tire mulch in a park (right) at 8 am, 12 am, 4 pm, and 8 pm.  She measured each features at four locations (except tire mulch which was measured at only one location) in her neighborhood on five days.  Her research revealed that the temperature of roads and pavement were higher than grass lawns at any time of the day.  She noticed that the surface of the tire mulch in the playground recorded the highest temperature 65°C (150 °F) at noon.

Changes in the Normalized Difference Vegetation Index
values of aspen and cottonwood leaves sampled in Laramie, WY
Mrudhula Baskaran a 10th grader at Laramie High School monitored spectral reflectance changes in aspen and cottonwood leaves.  Using an Alta II Reflectance Spectrometer she measured the spectral reflectance values of 10 leaves from each tree and computed the Normalized Difference Vegetation Index (NDVI).  She repeated these experiments on the 24th August, and the 2nd and 9th of September, 2012.  While the NDVI values of aspen trees declined during this period, the cottonwood trees showed no change.  This study helped her to see the relationship between the changes in leaf color and reflectance.

Acknowledgements:
Thanks to Dr. Alan Buss, University of Wyoming, for loaning the infrared thermometer and Alta Spectroradiometer, and Dr. Kevin Czajkowski, University of Toledo, for providing the infrared thermometer used in these studies.

Thursday, June 7, 2012

Landsat images help UW Lab School students learn about Africa’s natural diversity and environmental issues

With the help of Landsat images, 17 seventh and eighth grade students learned about Africa’s immense natural resource diversity and some of its environmental problems. Tim Blum and Cady McClurg, social science teachers, wanted to introduce their students “to the idea that a study of Africa ought not to dwell on the concept of the circle of life” as popularized in Hollywood movies.  However, they did not want students “locked into the concept that Africa is just one disaster after another.”

Students saw how large, mechanized wheat farms near the Masai Mara National Reserve (Kenya) reduced the natural grasslands that are crucial habitats for wildebeests; increasing population have cleared all but 1,500 acres of the original 250,000 acres of intact forest (Rwanda) and converted them to tea plantations; agricultural operations have expanded 10-fold in the Dakhla Oasis region (Egypt) that rely on waters from deep aquifers that cannot be easily recharged;  how 34 years of Kampala’s growth (Uganda) impacted adjacent forests and wetlands resulting in eutrophication of lakes (figure); growth of Moroccan cities along the Atlantic coastline; and how construction of dams resulted in less inflow and more aquatic plants in Ichkeul Lake (Tunisia).  Commenting on the value of these images Tim said “[they] helped my students grasp the idea that Africa is a very diverse continent.”

Landsat Images (the longest operating satellite remote sensing program) in this presentation were obtained from USGS and NASA websites (agencies jointly responsible for operating Landsat satellites).

These images contain a wealth of information that can be a valuable teaching resource used for to educate students about the environment and the changes caused by nature and humans.

This outreach activity was conducted on 22 May 2012 by WyomingView coordinator Ramesh Sivanpillai as part of AmericaView’s Earth Observation Day activities aimed at introducing teachers and students to remote sensing science and applications.

Image sources:
USGS: http://landsat.usgs.gov/gallery.php
NASA: http://landsat.gsfc.nasa.gov/image

Monday, June 4, 2012

Students in Laramie Junior High’s Scientific Perspectives class learn about leaves interaction with light (or electromagnetic radiation)

Students in Ms. Julie Eakin’s eighth grade scientific perspectives class at Laramie Junior High learned how different leaves interact with light and how they appear to human eyes.

Fifteen students were introduced to the principles of electromagnetic radiation and then how a leaf’s interaction changes based on factors such as pigments (chlorophyll), water content, surface area, and stress (insect damage, for example).


Based on these concepts students developed a hypothesis for comparing the reflectance properties of each leaf.  With ALTA ™ Spectrometers, they measured the spectral reflectance in 10 different regions of the electromagnetic spectrum.  Using standard reflectance values measured from white and black surfaces, they calculated percent reflectance for each leaf and plotted them against wavelength.

Analyses of these plots, termed the spectral signatures, revealed marked differences in the way each leaf interacted in different regions of the spectrum.  For example, a freshly cut aspen leaf and a blade of grass harvested several hours earlier had markedly different reflectance properties (figure).  Comparing results from each team, students could see how a leaf’s pigments, surface area, and vigor influenced its reflectance properties. 

This outreach activity was conducted on May 8 (2012) by Ramesh Sivanpillai, WyomingView coordinator, as part of AmericaView’s Earth Observation Day activities aimed at introducing teachers and students to remote sensing science and applications.

Monday, May 14, 2012

Sixth graders learn the value of satellite images for highlighting changes in urban areas and water bodies

Fifty-one students at Laramie Junior High School (LJHS) saw how satellite images collected since the 1970s can be used to monitor changes in cities and water bodies such as rivers and lakes. In Jared Long’s social science class, students are learning about urban growth and changes in water bodies caused by natural processes and human actions. In particular, they were comparing these changes in developed, developing and under-developed countries.

WyomingView coordinator Ramesh Sivanpillai described how satellites and aircraft are used to acquire these birds-eye images.  Using images acquired by Landsat and TERRA satellites, he demonstrated the growth of cities in the U.S., Mexico, Uganda and middle-East. These images were acquired 10-30 years apart. Students saw how cropland and forests were converted to urban areas to accommodate urban growth. Students also saw the video created by NASA that showed the yearly expansion of Las Vegas from 1974 – 2011. This video highlighted the mushrooming of Las Vegas and the addition of subdivisions, golf-courses and commercial areas. Satellite images also showed the new dams and reservoirs, changes in their water storage over time, and impacts of catastrophic events, such as flooding, can have on cities.


“Our students greatly benefited from this presentation” said Jared Long, social science teacher LJHS. “The presentation had been tailored to topics that have been addressed in our class over the course of the year, specifically how water bodies and urban areas change over time … our students' knowledge and engagement with these topics increased substantially.”

This outreach activity was conducted as part of AmericaView’s Earth Observation Day activities aimed at introducing teachers and students to remote sensing science and applications.

Thursday, April 19, 2012

Introducing Laramie Junior High School Students to Remote Sensing Concepts and Applications


One hundred and fourteen students in Ron Whitman’s eight grade physical and seventh grade biological sciences classes (three class periods each on April 4th and 5th, 2012) learned how remotely sensed images are acquired in different regions of the electromagnetic radiation (EMR) and their uses for monitoring earth surface features such as trees, crops, bare ground, water, roads, buildings, etc.

WyomingView coordinator Ramesh Sivanpillai described the differences in the interaction of earth surface features with EMR, and how those interactions result in their appearances or colors.  Students learned the uses of images collected by satellites and airplanes for monitoring the effects of beetle attacks on pine trees, deforestation, crop growth, and changes in the surface areas of lakes and reservoirs.  Mr. Whitman commented that the presentation helped “students understand the use of different electromagnetic waves for practical applications.”


In the lab, students working in teams used ALTA™ Spectrometers to measure spectral reflectance in 10 different regions of EMR.  Next, they calculated percent reflectance values, which were then plotted against wavelength to generate the spectral signature for each leaf.  

Analyses of these signatures led the students to conclude that the spectral signature of each leaf was distinct.  


Hands-on lab component for measuring and calculating “percent reflectance of the four types of leaves at different wavelengths, actively engaged the students the entire lab time” Mr. Whitman said.  Sivanpillai explained the differences in the spectral signatures of different earth surface features and remote sensing scientists rely on these signatures for mapping those features.

This educational outreach activity was conducted as part of AmericaView’s Earth Observation Day activities aimed at introducing teachers and students to remote sensing science and applications.

Thursday, March 1, 2012

Using satellite images 5th and 6th grade students in UW Lab School learn about human impact on environment

With the help of satellite images fifth and sixth grade students at Mr. Tim Blum’s geography class (photo above) at the UW Lab School (31 January 2011) got a birds-eye view of how humans have impacted or modified their environments.  Images acquired by satellites decades apart showed cleared forests, irrigated crop fields in the middle of the deserts, altered landscapes (new roads and water bodies), and urban growth. 

As part of the Earth Observation Day (EOD) activities, WyomingView coordinator Ramesh Sivanpillai described the utility of images acquired by satellites are useful for monitoring changes on earth’s surface.   

For example, Landsat images acquired in 2000 (bottom left) and 2009 (bottom right) shows the newly constructed roads, drilling pads, and ponds for an area within the Powder River Basin.


The goal of EOD activities is to introduce teachers and students to remote sensing science and technology and is promoted by AmericaView.  Sivanpillai works with individual teachers in Laramie-area schools and develops remote sensing course materials that relate to the topics taught to students.

Blum and his student teachers introduced students to the human impact on the environment.  The remote sensing “presentation fit with our curriculum and the students were captivated,” Blum commented.  “Your presentation certainly made an impression on our students because the information you provided was referenced in several discussions that occurred later in our unit.”  Tailoring materials to individual class needs increases student engagement and learning.

Tuesday, April 5, 2011

Laramie Junior High School Students learn about Remote Sensing Science and Career Opportunities

Infrared images acquired by Landsat
shows active fires "through-the-smoke".
Images acquired in human visible
region will be "covered with smoke".
One hundred and two students in Mr. Ron Whitman’s eighth (physical sciences) and seventh (biological sciences) grade classes (three class periods each on April 5th and 6th 2011) learned how remotely sensed data collected in different regions of the electromagnetic radiation (EMR) are used for looking at changes on the surface of the earth.

WyomingView coordinator Ramesh Sivanpillai showed satellite and aerial images collected in the visible region (for human beings) and beyond (infrared) and their utility for monitoring the surface of earth and the changes occurring in it.  Examples included monitoring water quality, deforestation, and wildfire damages (see Landsat images acquired during and after a wildfire event in Wyoming).

The post-fire infrared images acquired
by Landsat shows both the extent
and severity of the wildfire. US
Forest Service and other federal agencies
use Landsat and similar images for
assessing burn severity classes.
“Identifying the practical applications of remote sensing and how physical science concepts are used in remote sensing has been very beneficial to my class” commented Mr. Whitman.“Using different electromagnetic waves other than visible light to make observations is always intriguing to my class” he added.


Sivanpillai also discussed career opportunities in remote sensing and how students can academically prepare for them.  “Many students see the occupation opportunities involved with this field, especially the potential to travel and view many other geographic areas” said Mr. Whitman.  “Having professionals visit my classroom or going to their occupation site always motivates my students to try a little harder in my academically rigorous class”.


This educational outreach activity was conducted on April 5th and 6th (6 individual talks) as part of AmericaView’s Earth Observation Day activities aimed at introducing teachers and students to remote sensing science and applications.

Tuesday, February 22, 2011

Satellite Images show how Humans Impact their Environment: Earth Observation Day Event at Slade Elementary School


Sixth graders at Slade Elementary School (SES) saw how remotely sensed images collected by satellites orbiting the earth can be used for monitoring how humans are impacting their environment.  Students in Mr. Jared Long's and Mr. Andy Pannell's classes were learning about how humans are modifying their environment through their activities.

Mr. Pannell (left) and Mr. Long (right), 6th grade teachers
at Slade Elementary School, Laramie Wyoming.
Using satellite images acquired at different times, WyomingView coordinator Ramesh Sivanpillai highlighted human-made changes in different parts of the world.

For example, Landsat images showed how agriculture activities have expanded in Namibia, deforestation in Brazil and Rwanda, urban growth in Pearl River Delta (China), and Dubai, and shrimp farming in Ecuador.

Sivanpillai described the long history of remote sensing and the different platforms (pigeons, balloons, airplanes and satellites) that were used for collecting images in the visible and invisible (infrared) parts of the electromagnetic spectrum.

Student responses were "Learned a lot about earth (Zach)", "Different views of leaves! Really cool (Brianna)", "Change over time on earth very interesting (Liz)", "Wildfire pictures (Tamer)", and "very interesting, informative (Phoenix)", when asked "what stuck out" most from this presentation.  Mr. Long commented that "students and I really enjoyed" the presentation.


This outreach activity was conducted on February 22, 2011 as part of AmericaView’s Earth Observation Day activities aimed at introducing teachers and students to remote sensing science and applications.

Tuesday, March 30, 2010

Students learn how images acquired in the visible and infrared regions are used for monitoring changes in the earth’s surface

8th grade students in Mr. Ron Whitman’s Physical Science classes in Laramie Junior High School were introduced to remote sensing science and technology. Students learned how images were acquired in the visible and infrared regions of the electromagnetic spectrum and are applied in disciplines such as forestry (wildfires), agriculture (crop growth), range science (invasive species), and hydrology (lake level). 

Landsat images serve as an excellent educational aid to illustrate concepts in many scientific disciplines.  These images, collected once every 16 days, serve as a record of how features on the earth’s surface change from season to season within a single year as well as from year to year.  

Landsat image from 1986

Landsat image from 2002

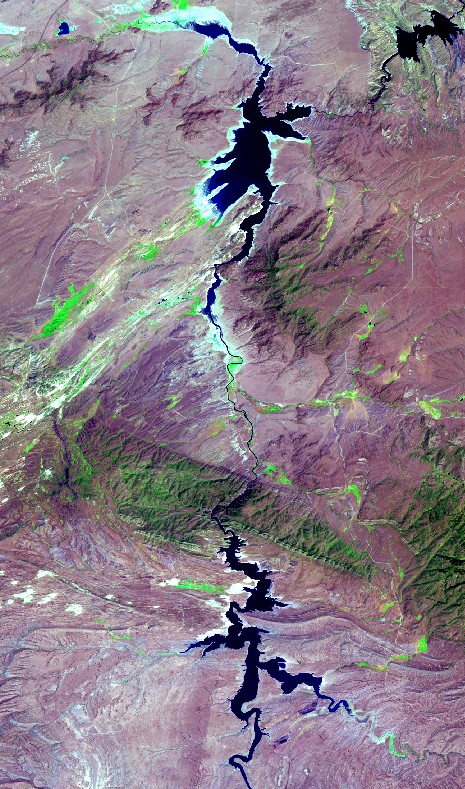
In the example shown above, images acquired in 1986 (normal year) and 2002 (drought year) show the amount of water in Seminole and Pathfinder Reservoirs, in SE Wyoming. Such images are helpful for illustrating concepts in disciplines such as Earth Sciences, Environmental Sciences, and Geography.

Mr. Whitman commented that the “presentation was very helpful in the students understanding of the practical applications of using electromagnetic waves in remote sensing. Students tend to think that only pictures using visible light can be useful in these observations of objects,… use of infrared and ultraviolet waves is quite beneficial”.

This outreach activity was conducted on March 29 and 30, 2010 by Ramesh Sivanpillai, WyomingView coordinator, as part of AmericaView’s Earth Observation Day activities aimed at introducing teachers and students to remote sensing science and applications.