Tuesday, June 1, 2010

Enhanced learning through student selected agricultural remote sensing projects

Article originally published in Reflections a publication of the UW College of Agriculture and Natural Resources (Publication date: June 2010; pages 56-58)

Access the issue online at: http://www.uwyo.edu/uwexpstn/publications/reflections/2010/reflections_2010.pdf (5.3 MB)

* * * * * * * * * * *

Enhanced learning through student selected agricultural remote sensing projects

Students utilize high-tech opportunities to examine Wyoming crop, ranch, and forest areas 


Carla Grefroh of Douglas, WY compares vegetation on her family’s ranch during drought and wet years

Images from earth observation satellites provide valuable information for students and researchers interested in monitoring natural resources. These remotely sensed images provide a bird-eye’s view of the earth’s surface and enable monitoring of rangelands, shrublands, and forests.

Many remote sensing satellites collect images at regular intervals, giving researchers an opportunity to monitor changes on the earth’s surface.  They can also be used to characterize variability in vegetation conditions within an agricultural field, ranch, or forest.  Vegetation growth stage (emergent vs. full canopy) and condition (healthy vs. stressed) can be determined by examining reflected infrared light, which is measured by many remote sensing satellites.

In general, remotely sensed images contain a wealth of information about the earth’s surface and are valuable for a wide range of users.

Remotely sensed satellites divide the earth surface into a uniform grid comprised of pixels and record the amount of reflected visible and infrared light coming to the satellite from each pixel.  Analysts examine the pattern of reflected light across a range of wavelengths to extract information about places in an image.  For example, a farmer can monitor changes in crop growth during the growing season using a series of Landsat images (Box 1).  A rancher can map forage conditions on a ranch and also identify areas of poor or no vegetation growth.

Box 1: Landsat images
Landsat images have been collected by a series of remote sensing satellites operated by the U.S. government since early 1970s (http://landsat.usgs.gov) and represent an extensive civilian archive in terms of duration (more than 36 years) and geographic coverage. Landsat collects a new image every 16 days for every place on earth.  Each image covers a relatively large geographic area (approximately 90 miles x 90 miles). Landsat records information from the visible region and the infrared regions of the spectrum, which is useful for monitoring vegetation condition and for a wide variety of other applications. Countless studies have demonstrated the value of Landsat data for monitoring changes in croplands, rangelands and forests. Landsat images are useful when monitoring rangelands and croplands through conventional field surveys is not feasible due to cost or access issues.

Increasing student employment potential

Changes introduced by natural disturbances, such as wildfires and droughts, and anthropogenic activities, such as land conversion, are creating new applications of remotely sensed imagery.  Because the imagery is so valuable, several countries have launched remotely sensed satellites to collect earth observation data.  In the U.S., federal and state government agencies, as well as private companies, are launching and operating remote sensing satellites. Students who learn image processing and interpretation skills as part of their academic training often increase their employment potential.

Ag remote sensing projects

UW students are learning to implement many of the applications described above in the Applied Remote Sensing for Agricultural Management (BOT/RNEW 4130/5130 and AECL4130) course.  One requirement of this course is that students complete a class project using imagery to answer questions about a real-world agricultural issue. For example, some students use images of their parent’s farm or ranch to obtain a better understanding of crop growth patterns by comparing the images to conditions observed on the ground.

Students associate areas of poor growth (often characterized by low infrared reflectance) identified in the image to problems such as soil alkalinity or poor water drainage.  Similarly, several students obtained images acquired in normal and drought years for rangelands and mapped changes in vegetation condition.  Students enhanced their learning experience by selecting images for areas of interest to them rather than working on pre-defined laboratory exercises.

Mapping crop growth in the Big Horn River Basin

Garret Klein and Laramie Wiginton (rangeland ecology majors), Chris Heil (agroecology major) and Travis Yeik (geography major) used Landsat images for monitoring crop growth in agricultural fields in Freemont and Washakie counties.

Klein and Wiginton mapped crop growth by computing a vegetation index derived from the amount of reflected red and infrared light.  Based on their research, they concluded Landsat images could be used to accurately identify areas of poor and medium growth for different crops; however, they noticed some weed infested areas also had high infrared reflectance due to dense canopy, thereby reducing the utility of Landsat data under these circumstances.

Yeik analyzed growth patterns in sugar beets and alfalfa crops in Worland using Landsat images acquired from 2006, 2007, and 2008.  This multi-year analysis of crop growth patterns was necessary for identifying areas of poor and high growth and for devising appropriate management plans to help improve crop yields.

Assessing wildfire damage to forest vegetation

Using Landsat images, Cody Tully estimated wildfire burn severity of a fire in Medicine Bow National Forest, Brice Stanton and Adam Stephens for a fire in the Black Hills National Forest, and Anne Morabito for a fire in Southern California. Stanton and Tully worked on firefighting teams and had firsthand knowledge of the impacts of fire on forest vegetation.  This knowledge was valuable for interpreting the information derived from Landsat images about burn severity patterns.

Cody Tully of Sinclair, WY helped fight the 2006 Isabelle Fire that burned near
Lake Owen in Southeast Wyoming. He is examining satellite images of the burn

Tully fought the 2006 Isabelle Fire that burned 1 mile south of Lake Owen in southeast Wyoming.  Burn Ratio Indices derived from the Landsat images acquired before and after the wildfire enabled him to distinctly classify the burned areas and also group them by severity classes.

Using the same method, Morabito (a California native) generated burn severity maps depicting various levels of damage caused by the Station Fire near Los Angeles in Southern California during August 2009.   Methodology used by these students is identical to the methods used by federal and state land management agencies tasked with fighting wildfires and monitoring vegetation establishment in burned areas.

Monitoring Wyoming Rangelands

Most students used Landsat images for monitoring rangelands throughout Wyoming.  Students compared vegetation condition during drought years to normal years and estimated the differences in spectral reflectance in different regions of the electromagnetic spectrum.  For example, Carla Gefroh (rangeland ecology major) compared the vegetation condition for her family ranch using images acquired in June 2002 and 2009, representing drought and wet years, respectively.  Landsat images highlighted changes in vegetation condition during the drought and wet years.

Monitoring vegetation response to drought was one topic in the class.  Other projects included monitoring vegetation condition in a growing season for estimating forage availability and areas of overgrazing.  The synoptic view provided by Landsat images was invaluable for gaining insights about vegetation condition in rangelands, and repeat coverage helped students to map those changes.

USGS Offers Landsat Satellite Images for Free

In December 2008, the entire Landsat satellite image archive was made available for free through the U.S. Geological Survey.  Previously, images had to be purchased (terrain corrected images could cost as much as $800) unless they were archived by programs like AmericaView (http://www.americaview.org) or on dedicated public Web sites like that of the Global Land Cover Facility (http://glcf.umiacs.umd.edu).

The recent availability of no-cost Landsat images has created opportunities and enhanced learning experiences for students. When fewer no-cost Landsat images were available, students had to modify the scope of their projects to match data availability.  Now, students can download any number of images for anywhere on earth.

UW students enrolled in the Applied Remote Sensing for Agricultural Management course are taking advantage of this valuable opportunity and are using these images for monitoring and mapping Wyoming croplands, rangelands, and forests.

Saturday, April 24, 2010

WyomingView interns highlight the utility of Landsat data for vegetation monitoring

Paul Arendt (BA Geography) assessed damages to conifer trees in the Sierra Madre Mountains of the Medicine Bow National Forest using Normalized Vegetation Difference Index (NDVI), and other vegetation indices such as straight ratios. Combining aerial survey data collected by the US Forest Service with Landsat images acquired during and prior to each survey year he calculated the magnitude of change in NDVI and other indices across different elevation ranges, and damage size categories.


Karley Shepperson (BS Rangeland Ecology & Watershed Management) tested whether Landsat data can distinguish sites infested with cheatgrass from those with native vegetation.  Four sites infested with cheatgrass and another four native vegetation sites were selected for this study.  Further she monitored changes in the reflectance pattern of these two sites during the course of the growing season (April through August) and concluded that images acquired in April and May showed maximum differences between the native vegetation and cheatgrass infested sites.

They presented their work in the Undergraduate Research Day on 24 April 2010.

Tuesday, March 30, 2010

Students learn how images acquired in the visible and infrared regions are used for monitoring changes in the earth’s surface

8th grade students in Mr. Ron Whitman’s Physical Science classes in Laramie Junior High School were introduced to remote sensing science and technology. Students learned how images were acquired in the visible and infrared regions of the electromagnetic spectrum and are applied in disciplines such as forestry (wildfires), agriculture (crop growth), range science (invasive species), and hydrology (lake level). 

Landsat images serve as an excellent educational aid to illustrate concepts in many scientific disciplines.  These images, collected once every 16 days, serve as a record of how features on the earth’s surface change from season to season within a single year as well as from year to year.  

Landsat image from 1986

Landsat image from 2002

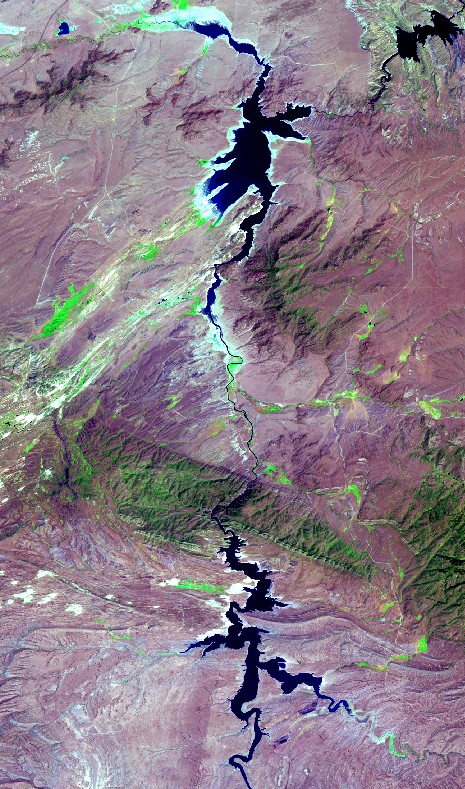
In the example shown above, images acquired in 1986 (normal year) and 2002 (drought year) show the amount of water in Seminole and Pathfinder Reservoirs, in SE Wyoming. Such images are helpful for illustrating concepts in disciplines such as Earth Sciences, Environmental Sciences, and Geography.

Mr. Whitman commented that the “presentation was very helpful in the students understanding of the practical applications of using electromagnetic waves in remote sensing. Students tend to think that only pictures using visible light can be useful in these observations of objects,… use of infrared and ultraviolet waves is quite beneficial”.

This outreach activity was conducted on March 29 and 30, 2010 by Ramesh Sivanpillai, WyomingView coordinator, as part of AmericaView’s Earth Observation Day activities aimed at introducing teachers and students to remote sensing science and applications.

Saturday, May 2, 2009

UW Range students present wildfire damage assessment research in the 2009 Undergraduate Research Day


Adam Stephens and Brice Stanton (BS Rangeland Ecology & Watershed Management major) presented their research on mapping burn severity near Deadwood, SD using Landsat images acquired prior and after the Grizzly Gulch Fire.  Brice had first hand knowledge of the burn severity at these sites from his work with the US Forest Service.  They determined burn severity classes, based on the changes in the Normalized Burn Ratio Index (NBRI) values in pre- and post-fire images.

Sites that burned the most (high severity) witnessed a large drop in their NBRI values between the pre- and post-fire images, while the unburned sites had no change.  They were able to associate remaining burn categories to the magnitude of change in the NBRI values.

Post-fire Landsat infrared image
Post-fire NBRI image
Burn severity map derived from pre- and post-fire Landsat images

Describing the value of this project in terms of his career, Brice said "I learned how to use remote sensing and apply it to the forest, by either grass management, or by being able to map a fire, and by learning how to do this I will be able to use what I have learned to be able to make decisions on the forest that I work."

This presentation was the second presentation by the WyomingView interns in annual Undergraduate Research Day event.

Title:  Mapping Burn Severity within the Grizzly Gulch Fire Using Remote Sensing Techniques.
Their presentation can be viewed at UW Digital Library.

Sunday, December 28, 2008

UW Ag students use satellite images to evaluate crop- & range-land

Source: UW Extension Service's press release
By: Steven L. Miller, Senior Editor
Date: 28 Dec 2008

Agriculture students in a University of Wyoming class used remote sensing information to analyze crop and rangeland they are either familiar with or farm and ranch upon. 

The class, taught by Ramesh Sivanpillai, remote sensing scientist with the Wyoming Geographic Information Science Center (WyGISC) in the College of Agriculture building, examined crop and pasture lands using satellite images obtained through WyomingView. 

WyomingView is a consortium, headed byWyGISC and the University of Wyoming, aimed at increasing opportunities for remote sensing through outreach, data distribution, education, training and research activities in Wyoming. WyomingView is part of AmericaView, which is funded by the U.S. Geological Survey (USGS). 

Student Vince Holton wanted to eye his crop land in northern Colorado and pasture he leases between Laramie and Cheyenne. He could not obtain free satellite images for his Colorado cropland for the years he was interested in, but images collected by Landsat satellites of his Wyoming pasture were available through WyomingView. 

He had a “prove it” attitude. “I wanted to see how it worked; if it actually showed what I had observed on the ground,” he said.  The images provide variations in light reflectance of vegetation, which can show levels of plant vigor. 

“That tells you if it’s real productive, dormant or dead,” said Holton, of Greely, Colo. “But you have to know what you are looking at. You can’t take somebody else’s place; not having been there, you only can guess. You still have to do the groundwork to know what you are looking at. It works slick on farm ground, but it works good on rangeland, too. But you need help on which satellite image to use and how to configure it so you get the right values. It’s not something you can jump on and pop it out.” 

Holton said he’d like to use remote sensing in future operations. “I’d like to get more advanced so I know what I’m doing,” he said. “I got enough out of it I sure could see a heckuva value, especially in farming.” 

Garrett Klein and his lab partner, Laramie Wigington, both of Pavillion, northwest of Riverton, used the class to look at center pivots on Klein’s family land near Fort Washakie. 

“We changed from flood irrigation to pivot irrigation in 1998,” said Klein. “I wanted to see if the crop yields were increasing or if helping improve the ground (fertility).” 

The project was of particular interest to both. “I grew up a half-mile away from the ground,” said Wiginton. “We worked on the same ground together since elementary school.” 

They examined Landsat images from July and August from 1998 to 2006. The software program illustrates crop vigor through the years. “It allows us to see if an area of the field is consistently good or consistently bad,” said Klein. 

Klein, familiar with the farm ground, said he remained a skeptic of the process while using the program. “So far, it’s been correct,” he said. 

In the satellite images, they were able to match the growth patterns observed in the barley and alfalfa fields and distinguish areas where barley grew well and poorly due to alkaline soil, said Sivanpillai. “However, Landsat images were less useful when portions of the field were covered with weeds. For smaller farms, they concluded that high-resolution imagery taken at right time of growing season could be more helpful.” 

Landsat images are useful for monitoring crop growth, although the information content are less than the images seen in programs such as Google Earth, Sivanpillai noted. Landsat images are updated every 16 days, and the USGS is planning to make the entire Landsat image archive (going back to early 1970s) free in a year or two, enabling everyone to use these applications for monitoring their agricultural lands.


###

Saturday, April 26, 2008

WyomingView intern Salerno highlights the utility of Landsat images for zoning crop field

Vincent Salerno (BS Rangeland Ecology & Watershed Management major) highlighted the utility of Landsat images for mapping variability in sugar beet growth.  His research was focused on generating information required for zoning fields based on how crops grows.  After zoning their fields, farmers can apply appropriate amount of fertilizers and other chemicals instead of treating the entire field as a single unit.

Landsat image of the sugar beet field in Worland, WY
Vincent Salerno, recipient of the spring 2008 WyomingView internship, processed Landsat images acquired in 2006 and 2007 for a field (192 acres) in Worland, Wyoming.

Vince digitally classified the images and identified areas of high, medium and low vigor (or growth) within the field.  By comparing crop growth patterns from both years, he generated a zone map for this field.

He reported that the infrared bands of the Landsat images are useful for identifying differences in crop growth.  Further he recommended that images of this farm, acquired in earlier years can be used for identifying past patterns of crop growth which can be used for refining the zone map.


This research was made possible through the invaluable support of Mr. Jim Gill, Wyoming Cooperative Extension Service agent for Washakie County, WY.

Vince presented his findings in the Wyoming Undergraduate Research Day events on 26 April 2008.
Title: Satellite Remote Sensing Technology for Identifying Variability in Sugar Beet Growth.

His presentation can be viewed in the UW Digital Library

Thursday, November 16, 2006

3rd graders in Laramie's Beitel Elementary School learn about remote sensing

Students in the 3rd grade of Beitel Elementary School, Laramie were introduced to remote sensing through a combination of ground photographs and aerial images of their school and its surroundings. Students interpreted features on the true color and infrared photos.

Students compared Laramie's prominent landmarks (UW War Memorial Stadium, Arena etc) in aerial and conventional ground-based photos.

Following this, they looked aerial photographs and described how different areas of their school from a vertical or birds-eye view.

This educational evening activity was conducted on 16 November 2006 by WyomingView Coordinator Ramesh Sivanpillai, and WyGISC Research Scientists Ken Driese and Wendy Berelson as part of the Earth Observation Day.

Friday, February 24, 2006

UW College of Ag personnel and students learn to analyze crop growth with Landsat images

Eleven UW College of Agriculture personnel and students learned how remote sensing technology can help distinguish patterns of good and poor growth in crops.  In a workshop conducted by WyomingView they learned to display and analyze remotely sensed images in ERDAS ViewFinder (EVF), a freeware image viewer.


Participants saw the value of Landsat's infrared bands for highlighting crop growth differences and how reflectance values in those bands can be related to growth patterns (or vigor).  They collected reflectance values of features such as crops, rangelands, water and built surfaces (asphalt roads) to gain insights about how each feature interacted with electromagnetic radiation.

Analysis of crops showed that variability in the near-infrared reflectance (band 4) values of Landsat can be associated with the patterns of crop growth within a field.

Finally, using a measurement tool in EVF, they learned to calculate areas of poor, medium and low growth within a field.  Other sources of satellite and aerial images (SPOT, IRS, IKONOS and Quickbird) for agricultural applications were discussed.


Participants provided the following (anonymous) feedback about this workshop:

  • Excellent.  Has peaked [sic] my interest in research applications of this technology
  • Amazing freeware.  Almost as powerful as the old ERDAS software I have used
  • Great workshop.  I appreciate the background information and all the examples
  • Good workshop, very interesting!

This WyomingView education and outreach activity was conducted by Ramesh Sivanpillai on 24 Feb 2006 as part of the annual Wyoming Agriculture Experiment Station's Research & Extension Center Planning Conference.

Friday, September 23, 2005

WCES personnel learn to display and manipulate Landsat images in ERDAS ViewFinder

Wyoming Cooperative Extension Service (WCES) personnel learned to work with remotely sensed images in ERDAS ViewFinder (EVF), a freeware image viewing and analyzing software.  WCES personnel can install EVF in their computers and do not have to periodically renew its license.  WCES personnel learned to change Landsat band combinations, obtain pixel reflectance values at specific locations, and compute areas of features such as rangelands, crop fields, and water bodies.


By displaying Landsat images in different combinations (true color, false color infrared etc.), participants learned to highlight vegetation growth in rangelands, crop growth in fields, and differences in water quality.

Some participants suggested that this 1/2 day workshop should be expanded (1- or 2-day workshop) to accommodate more examples, while others wanted to take Landsat data in a portable devices to their offices to work on problems specific to their county/region.

This WyomingView education and outreach activity was conducted by Ramesh Sivanpillai on 23 September 2005.

Tuesday, December 2, 2003

Satellite imagery can help producers identify problems early

Source: UW Extension Service's press release
By: Vicki Hamende, Writer and Editor, Office of Ag Communications and Technology
Date: 2 Dec 2003

Orbiting satellites collecting data about land surfaces can help Wyoming producers learn information like where leafy spurge infestations are on the move and whether pastures are being overgrazed or undergrazed.

Through a year-old U.S. Geological Survey-funded program called WyomingView, investigators with the Wyoming Geographic Information Science Center (WyGISC) hope to partner with the University of Wyoming Cooperative Extension Service to use mapping and spatial analysis at the grass roots level to save time and money for ranchers and farmers.  Located in newly remodeled offices in the College of Agriculture building, the center is the state’s largest repository of geospatial data used by industries, state and federal agencies, nonprofit organizations, and private citizens.

WyomingView is part of AmericaView, a program that promotes remote sensing technology, education, and research. “CES fits in on the education side,” says Kenneth Driese, principal investigator for the project. “Extension agents can make contact with individual ranchers and farmers who might be interested in improving their operations.”

The services are free to producers, who simply file a request for particular overhead images of their property and receive the records they have asked for either through their own computers or through a limited number of provided satellite dishes and computers.

Information gleaned from downloaded photographs can distinguish cured grass from new growth, monitor the necessity for fungicide treatments, test the success of variable rate nitrogen applications, determine spray drift damage, and analyze how the discharge of water from coalbed methane operations is impacting rangelands.

One farmer in North Dakota, headquarters of the Upper Midwest Aerospace Consortium of which UW is a member, was able to increase his income by $33 per acre after learning through satellite imagery that he was applying herbicides inadequately.

“The satellite can pick up plant distress caused by things like wind damage or pest attack or nutrient deficiencies long before the human eye can,” explains Ramesh Sivanpillai, coordinator of WyomingView. By studying color-coded aerial material, he says, producers can monitor their fields to spot damage before it is too late to reverse it. Driese points out that WyGISC’s direct connection to the USGS data center guarantees that producers can receive current information within a day or two of when it is requested.

Satellite image of Farson, WY
“This year we collected several images during the growing season that we gave to the Natural Resources Conservation Service to report to farmers,” Sivanpillai says. “CES can be using the same technology.”

The two scientists say College of Agriculture Dean Frank Galey and Associate Dean and CES Director Glen Whipple have expressed excitement about the opportunity. The WyomingView colleagues have also met with some CES agents and say they are eager to travel to different counties to make presentations about the services and free software they offer.

“One area we are discussing with Glen is how we can work together to train CES people and to find out what type of information they need,” Sivanpillai says. “I think this technology can help the way CES people do their jobs. They can help producers use images to do comparative analyses and pilot studies to predict yields. We hope the CES people will be able to help the end users.”

Driese says WyomingView is trying to build a UW-based consortium of data consumers in the state. “We are reaching out to federal agencies and community colleges and CES and NRCS to get the coalition growing,” he explains. “We’d like to make educational opportunities more available both at the UW level and outside the university.”

Driese says the program is also trying to add more data to the www.wygisc.uwyo.edu/wyview Web site. “For a state so sparsely populated, Wyoming is pretty far ahead of some areas in developing spatial data that farmers and ranchers can access,” Driese says. “There’s quite a lot of expertise growing on how to use it.” He notes that there are companies that provide sophisticated spectral analysis in parts of the country with more industrialized farming.

Sivanpillai says the program can help most producers in the state no matter how limited their holdings. “We’re small enough in Wyoming that they can just stop by or give us a call.”